ArcRefine improves de novo binder designs while preserving binding modes
Article contents
AbstractIntroductionResultsDiscussionMethodsAcknowledgementsCompeting interestsData availabilityCode availabilityReferencesSupplementary informationSupplementary Table S1. Lineage of submitted optimized sequencesSupplementary Table S2. Experimentally positive optimized sequencesSupplementary Table S3. Paired sequences for representative designsThis manuscript has not been peer reviewed. HTML and PDF present the same manuscript, including supplementary information.
Abstract
De novo protein design now enables the creation of high-affinity binders from a target structure alone. However, current design methods face a trade-off between site control and success rate. Generative models such as RFdiffusion and BoltzGen place binders at chosen sites but often require large candidate pools. Hallucination methods such as BindCraft and Mosaic update sequences using gradients from structure predictors and achieve high success rates, but they build binders from random sequences and cannot refine a given design while keeping its binding mode. We introduce ArcRefine, a gradient-based refinement method that uses structural carryover to preserve a binder’s fold and binding mode during sequence optimization. It works by reusing Boltz-2’s single and pair representations to condition each new prediction on the previous complex. Despite changes to about two-thirds of the amino acid residues, fresh predictions retained the starting interface in 45/60 PD-L1 and 23/60 TNF designs. Mean interface confidence (ipSAE) increased in all six other predictors tested, with pooled median ipSAE rising from 0.49 to 0.69. Using this approach, we obtained six BLI-confirmed binders from ten submitted designs against TNF, a target with few reported de novo binders, compared with one of ten unoptimized candidates from the same generated pool. Carryover can be combined with additional differentiable loss terms and also extends to the design of binders to DNA and small molecules.
Introduction
De novo protein design now enables the creation of high-affinity protein binders from a target structure alone [1,2,3]. Over the past few years, advances in deep learning have substantially improved experimental success rates and expanded the range of targets accessible to computational design [2,3]. These developments make it increasingly feasible to create new binding interactions for biological research and therapeutic development.
Many applications require control over where and how a designed protein binds its target. Blocking a protein–protein interaction requires binding at an interface that prevents partner association, whereas stabilizing a particular conformation requires recognition of structural features specific to that state. A successful design must therefore combine affinity with a binding mode appropriate for its intended function.
A site required by the intended function can be hard to bind. At such sites, extensive computational sampling and experimental screening are needed to identify successful binders, increasing the overall cost of design. Efficient design requires methods that combine control over the binding site with a high success rate.
Generative models are one major family of binder design methods and can take the site as an input. RFdiffusion, RFdiffusion3, PXDesign, BoltzGen and Complexa can build backbones and interfaces around hotspots or binding regions chosen by the designer [3,4,5,6,7]. However, achieving useful yields at a chosen site requires extensive sampling. BoltzGen recommends generating 10,000 to 60,000 designs per target and filtering them to the few that go to the laboratory [8]. Low yields are especially evident for some difficult targets: for TNF, AlphaProteo reported no binders among 54 tested designs [9], and BoltzGen, PXDesign and Complexa also reported failures [6,5,7], although other campaigns have obtained binders [10,11].
Hallucination methods provide another approach. BindCraft and Mosaic start from a random sequence and update it by gradients through a structure predictor until the predictor reports a confident complex [12,13]. These workflows have achieved high experimental success rates [12,14]. BindCraft’s documentation notes, however, that difficult targets or particular sites can require extensive sampling or yield no designs passing its filters [15]. Designers can specify target hotspots, but these are not enforced, so hallucination alone cannot reliably place binders at a chosen site.
The open problem lies between the two families. A generated design already has a site and a binding mode, which makes it the natural starting point for refinement. Gradient-based updates are an efficient way to raise a predictor’s confidence in a complex. The problem addressed here is to retain the starting site and binding mode during those updates. Solving it would let generation supply the site and gradient-based optimization refine the candidates, so fewer designs would need to be generated and filtered. It would also show whether binders to difficult targets such as TNF can be designed more efficiently.
Here we introduce ArcRefine, a method for refining existing binder designs by gradient-based sequence optimization. ArcRefine uses structural carryover: it passes the predictor’s single and pair representations from one sequence update to the next. With carryover, gradient-based optimization through Boltz-2 raises the predicted interface confidence of an existing design while keeping its binding site.
We tested carryover on two targets, PD-L1 and TNF. Three questions guide the evaluation: do designs stay where they were placed, does the predicted confidence also improve in structure predictors not used in the optimization, and do the optimized designs bind their targets in experiments more often than unoptimized designs? We also tested computationally whether carryover works for DNA- and small-molecule-binding proteins.
Results
ArcRefine uses structural carryover to connect successive sequence updates
In gradient-based refinement of a generated design, the binder sequence is updated step by step to raise the predictor’s confidence in the complex, and we want these updates to keep the design’s site and binding mode. However, the predictor predicts the complex for each new sequence from scratch, so nothing connects the predicted complex to the design that the updates began with, and the binding mode can be lost as the sequence changes. To prevent this, structural carryover passes the predictor’s single and pair representations from one sequence update to the next so that each prediction is conditioned on the previous one.
Figure 1A shows the four-step ArcRefine optimization loop. (1) We run Boltz-2 on the original binder sequence and the target and retain the resulting single and pair representations. These initialize the structural state, while the binder sequence probabilities are initialized randomly. (2) Boltz-2 predicts a complex from the current binder sequence probabilities and the fixed target, conditioned on the retained representations. (3) We update the binder sequence probabilities using gradients from an objective combining structural confidence with a ProteinMPNN-derived sequence–structure compatibility term (Methods). (4) We retain the new prediction’s single and pair representations for the next iteration and return to step 2. The retained state thus conditions the next prediction while both the sequence and structure remain free to change.
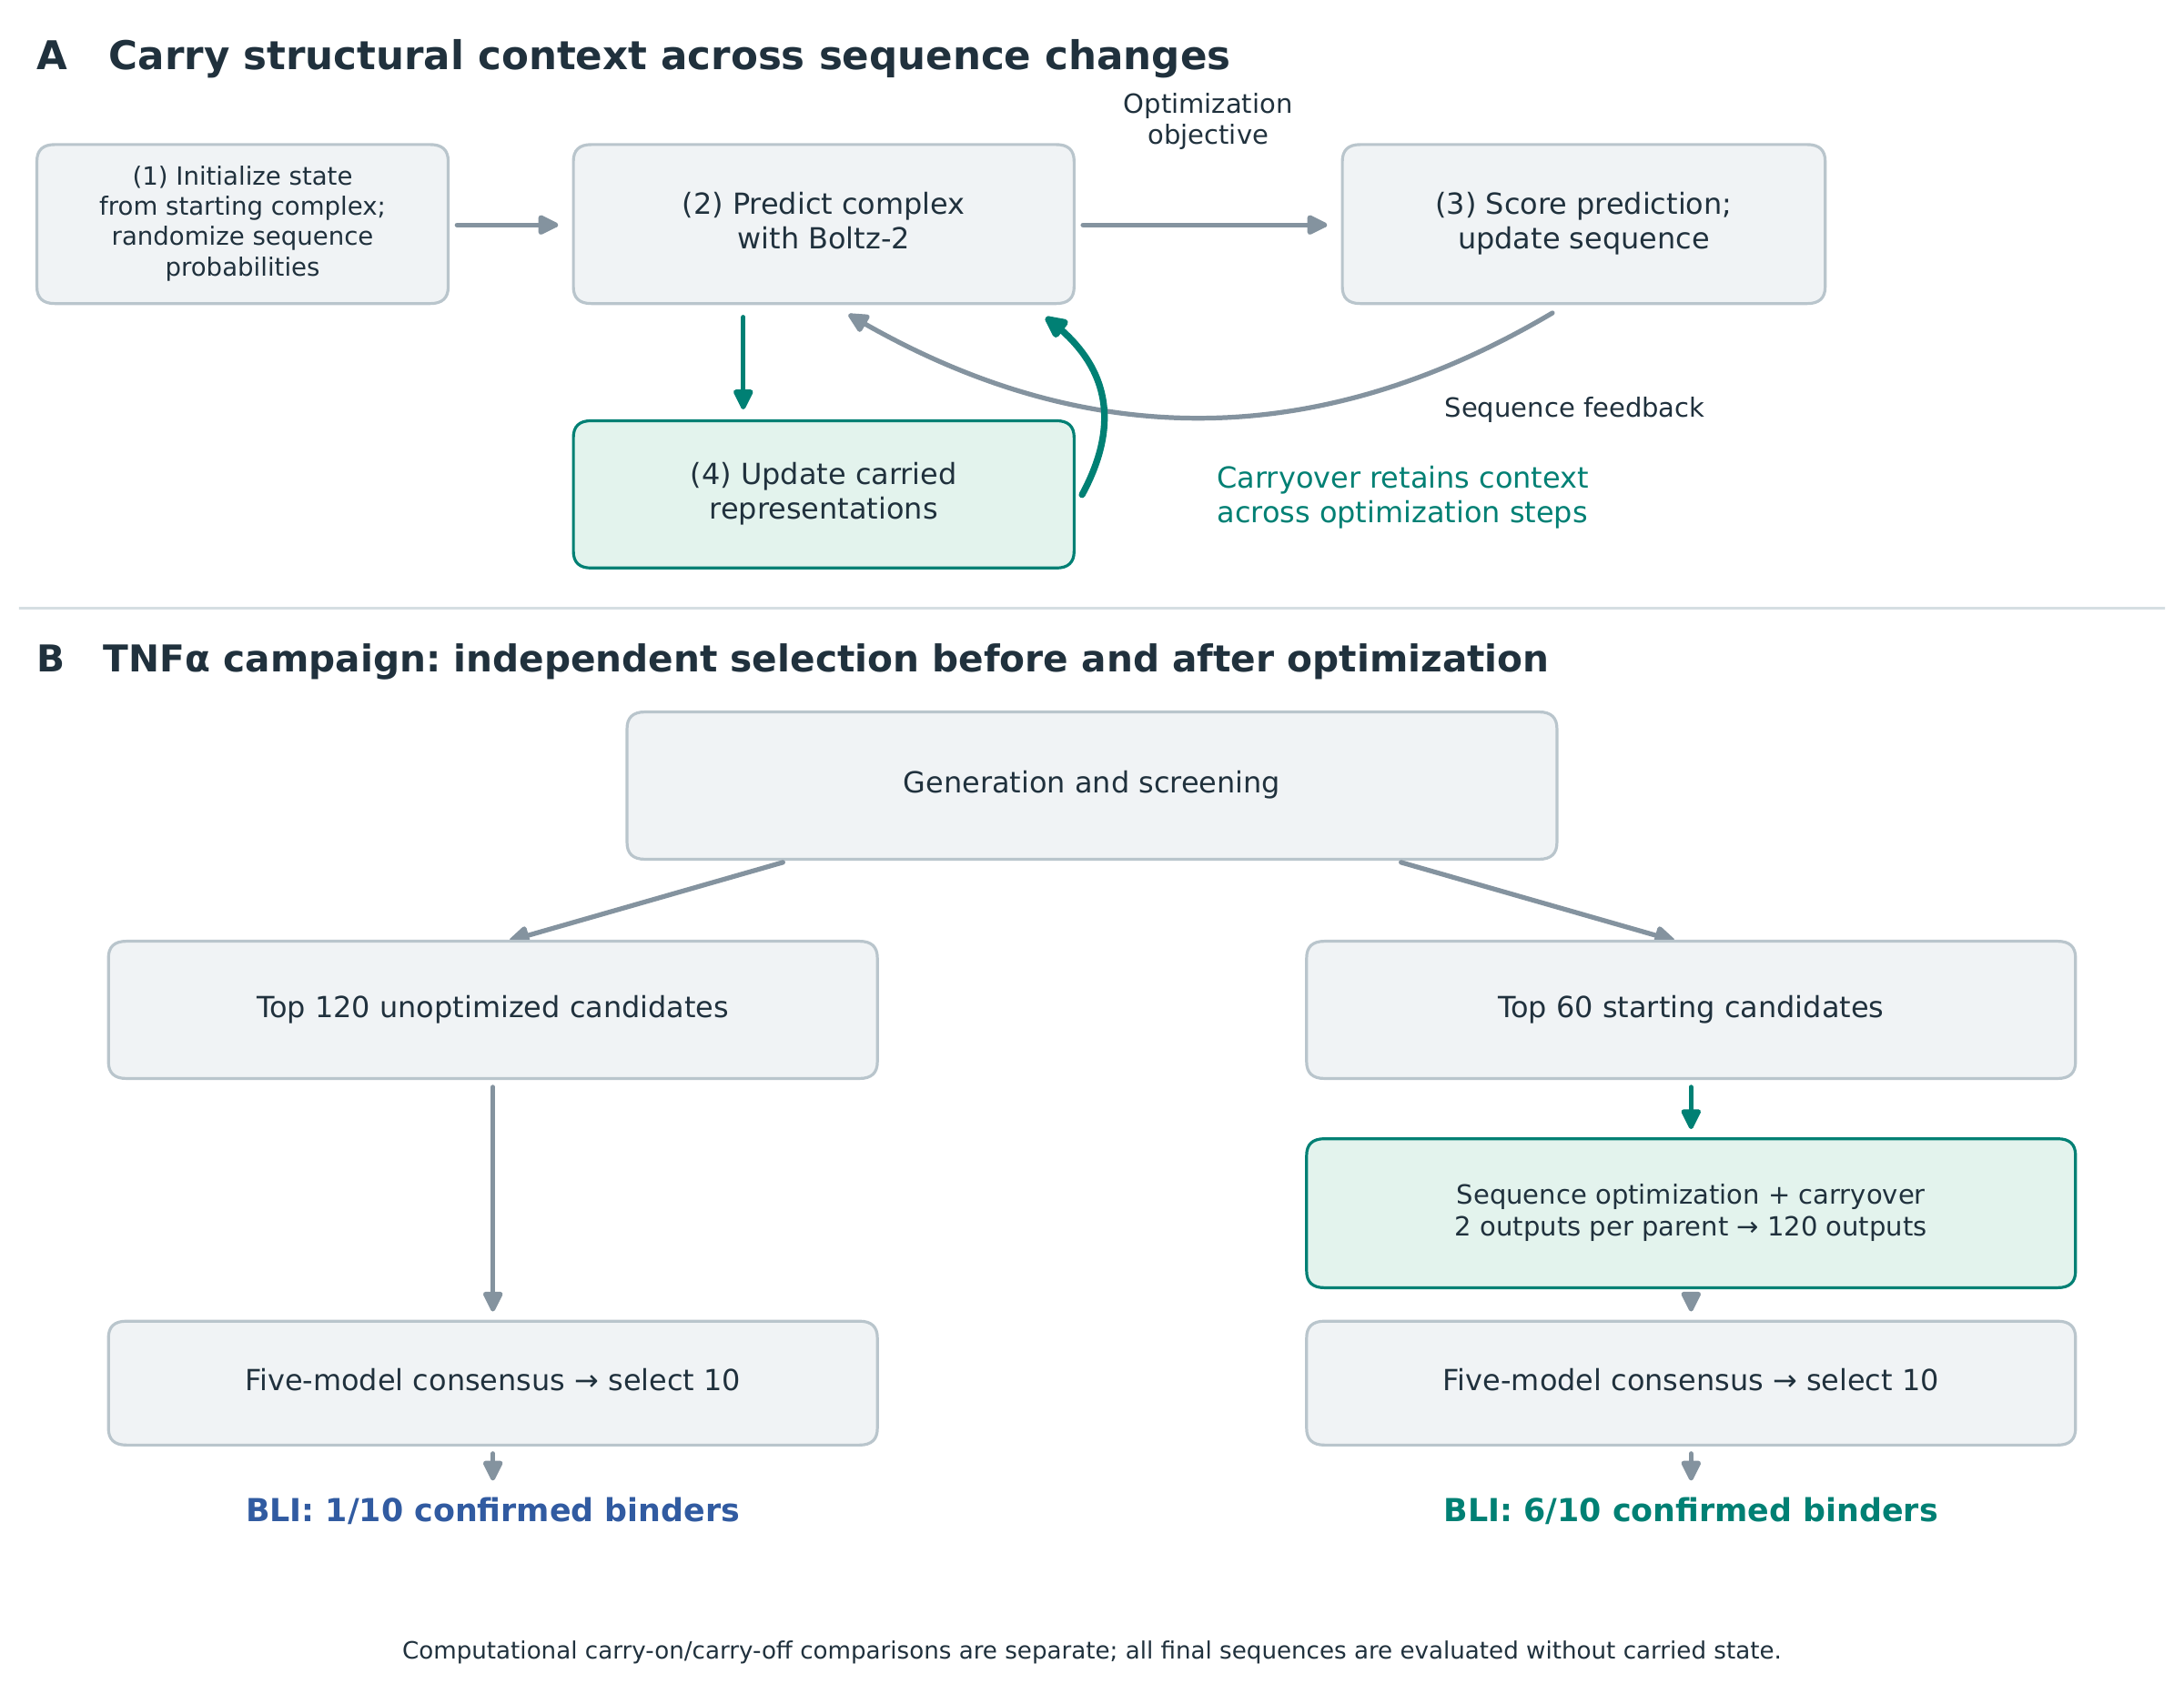
We evaluated carryover on 60 starting designs for each of two targets: PD-L1, which has a well-characterized PD-1-binding surface [16], and TNF, a homotrimeric cytokine and an approved-drug target [9,17]. The designs came from a pipeline that combined four generative models. The 60 top-ranked designs per target, ranked on Boltz-2 interface confidence, came from three of them: PXDesign, RFdiffusion3 and Complexa (Methods). For each starting design, we compared the original sequence with two optimized sequences: one from optimization with carryover (carry-on) and one from the same optimization without it (carry-off). We then predicted the complexes of the original, carry-on and carry-off sequences again, without the carried state (fresh predictions), using seven structure predictors (Boltz-2 and six others).
Carryover retains the starting fold and interface through extensive sequence changes
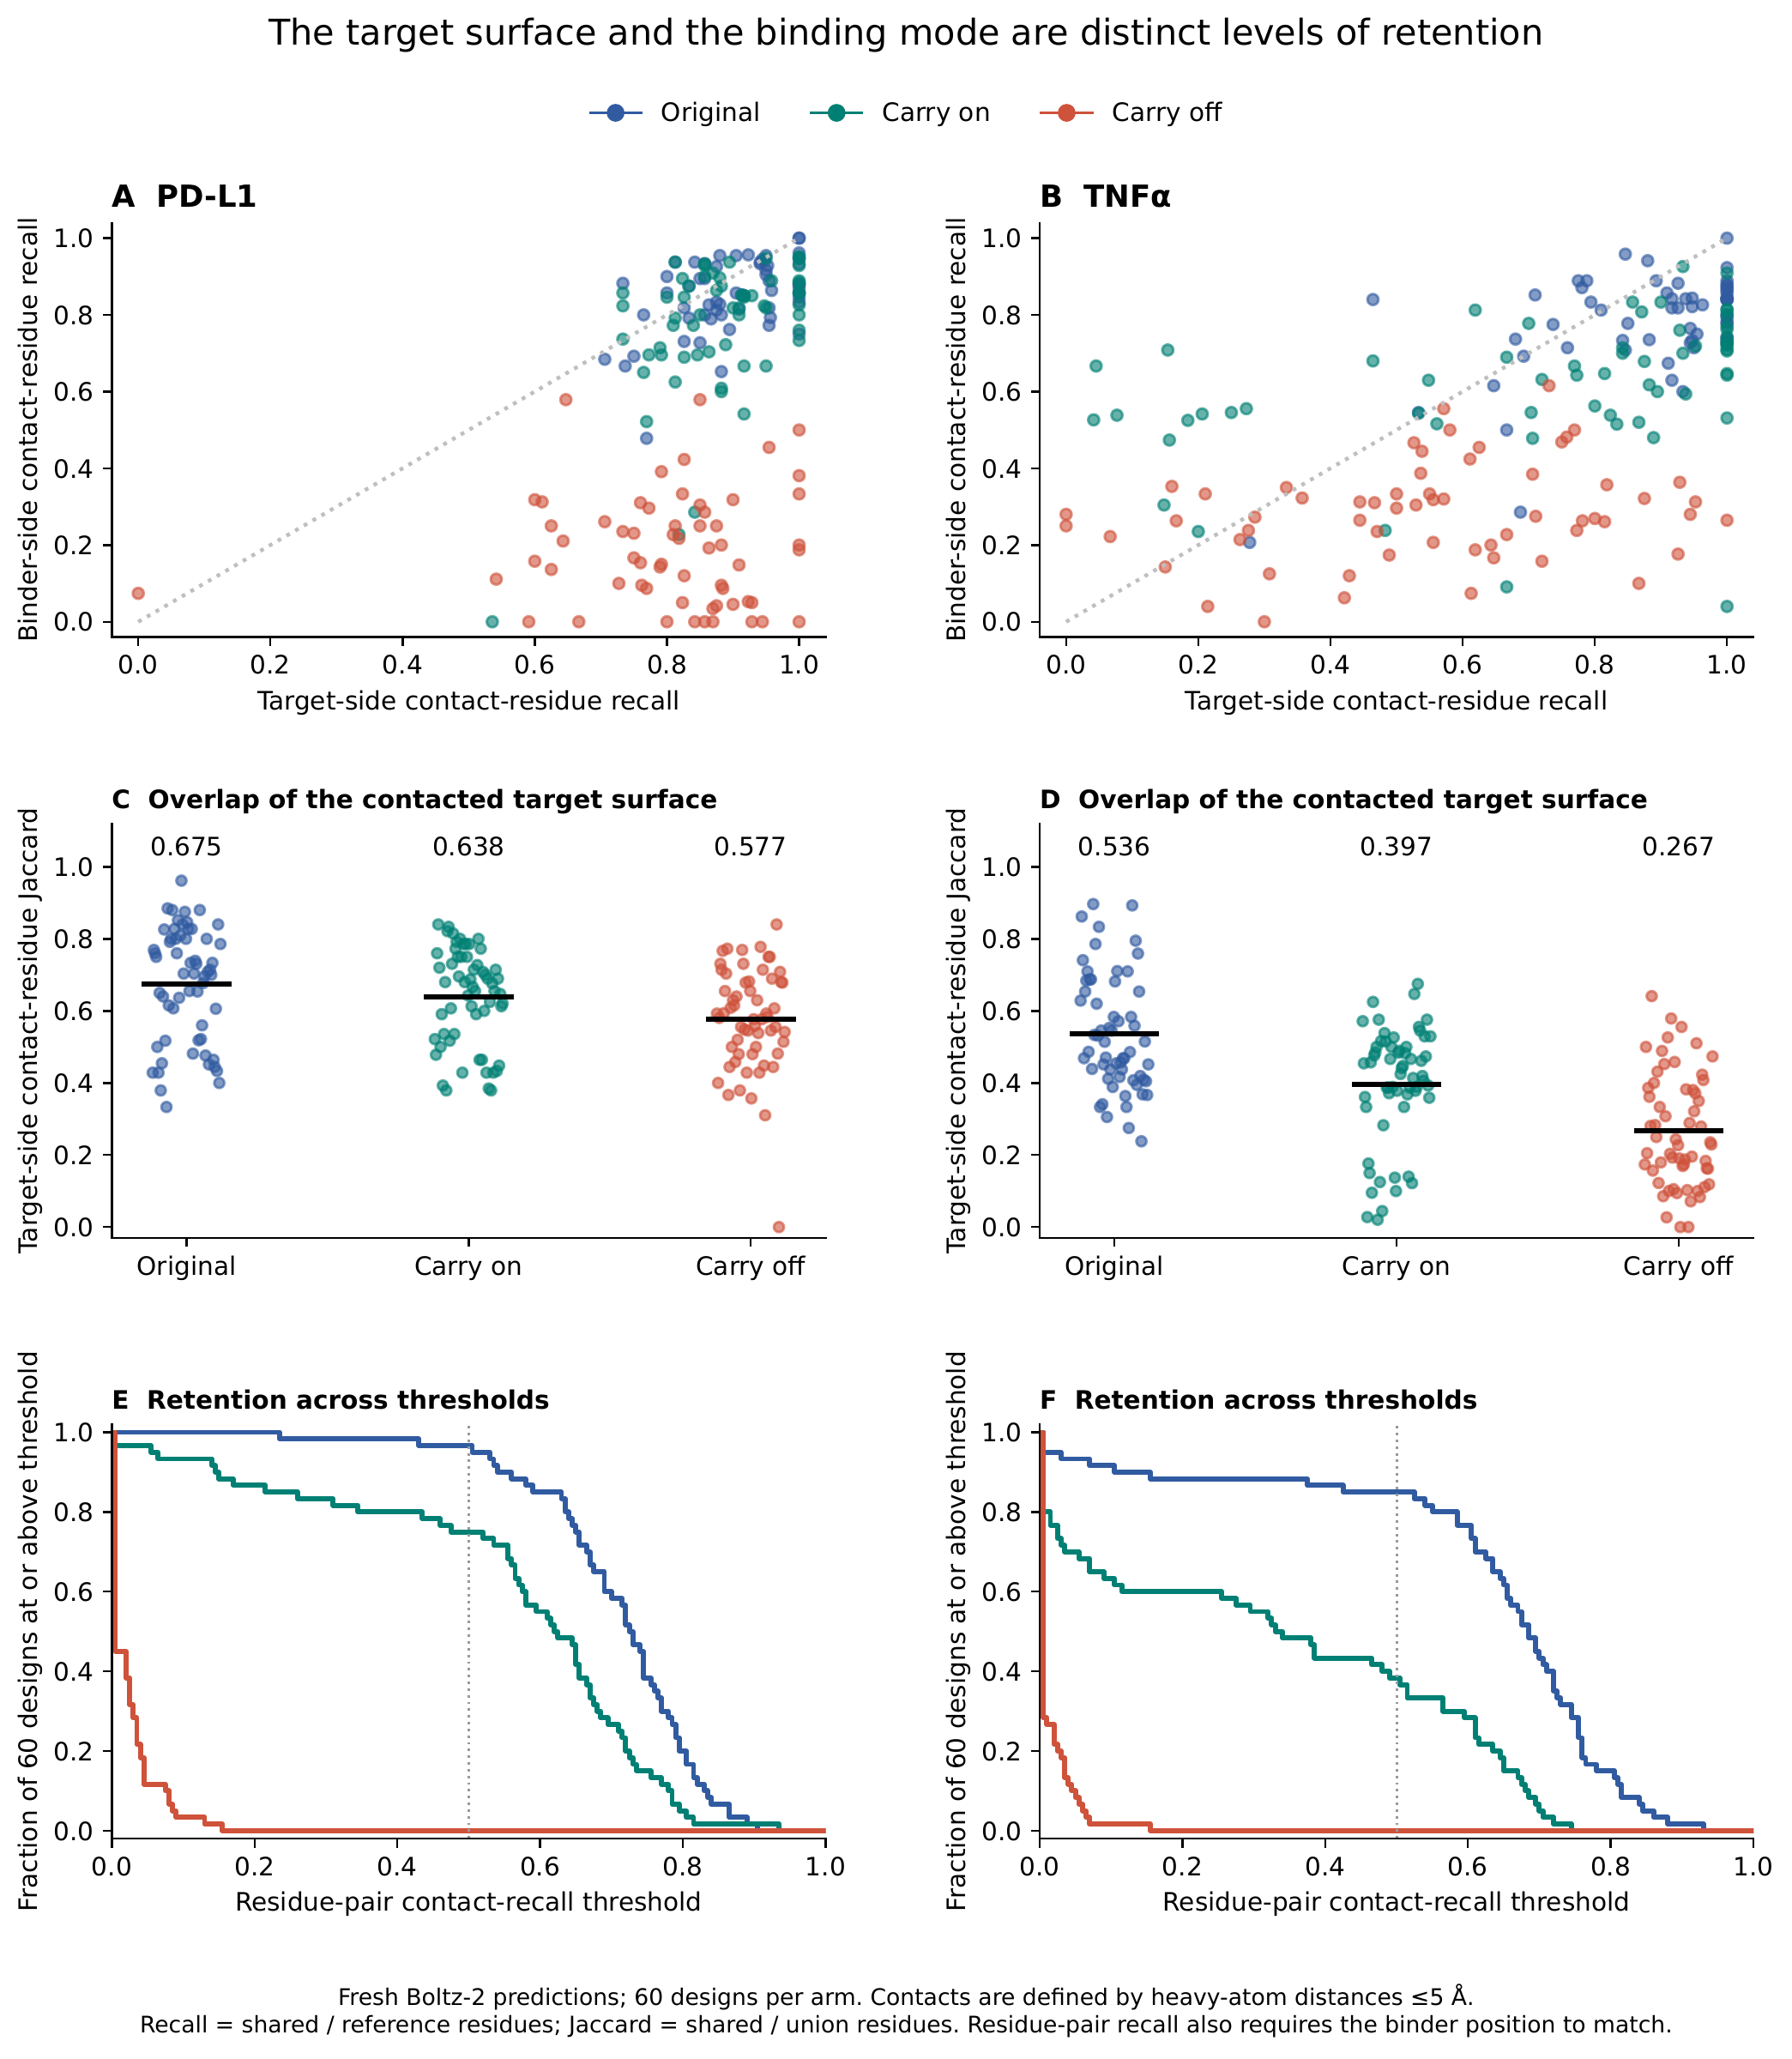
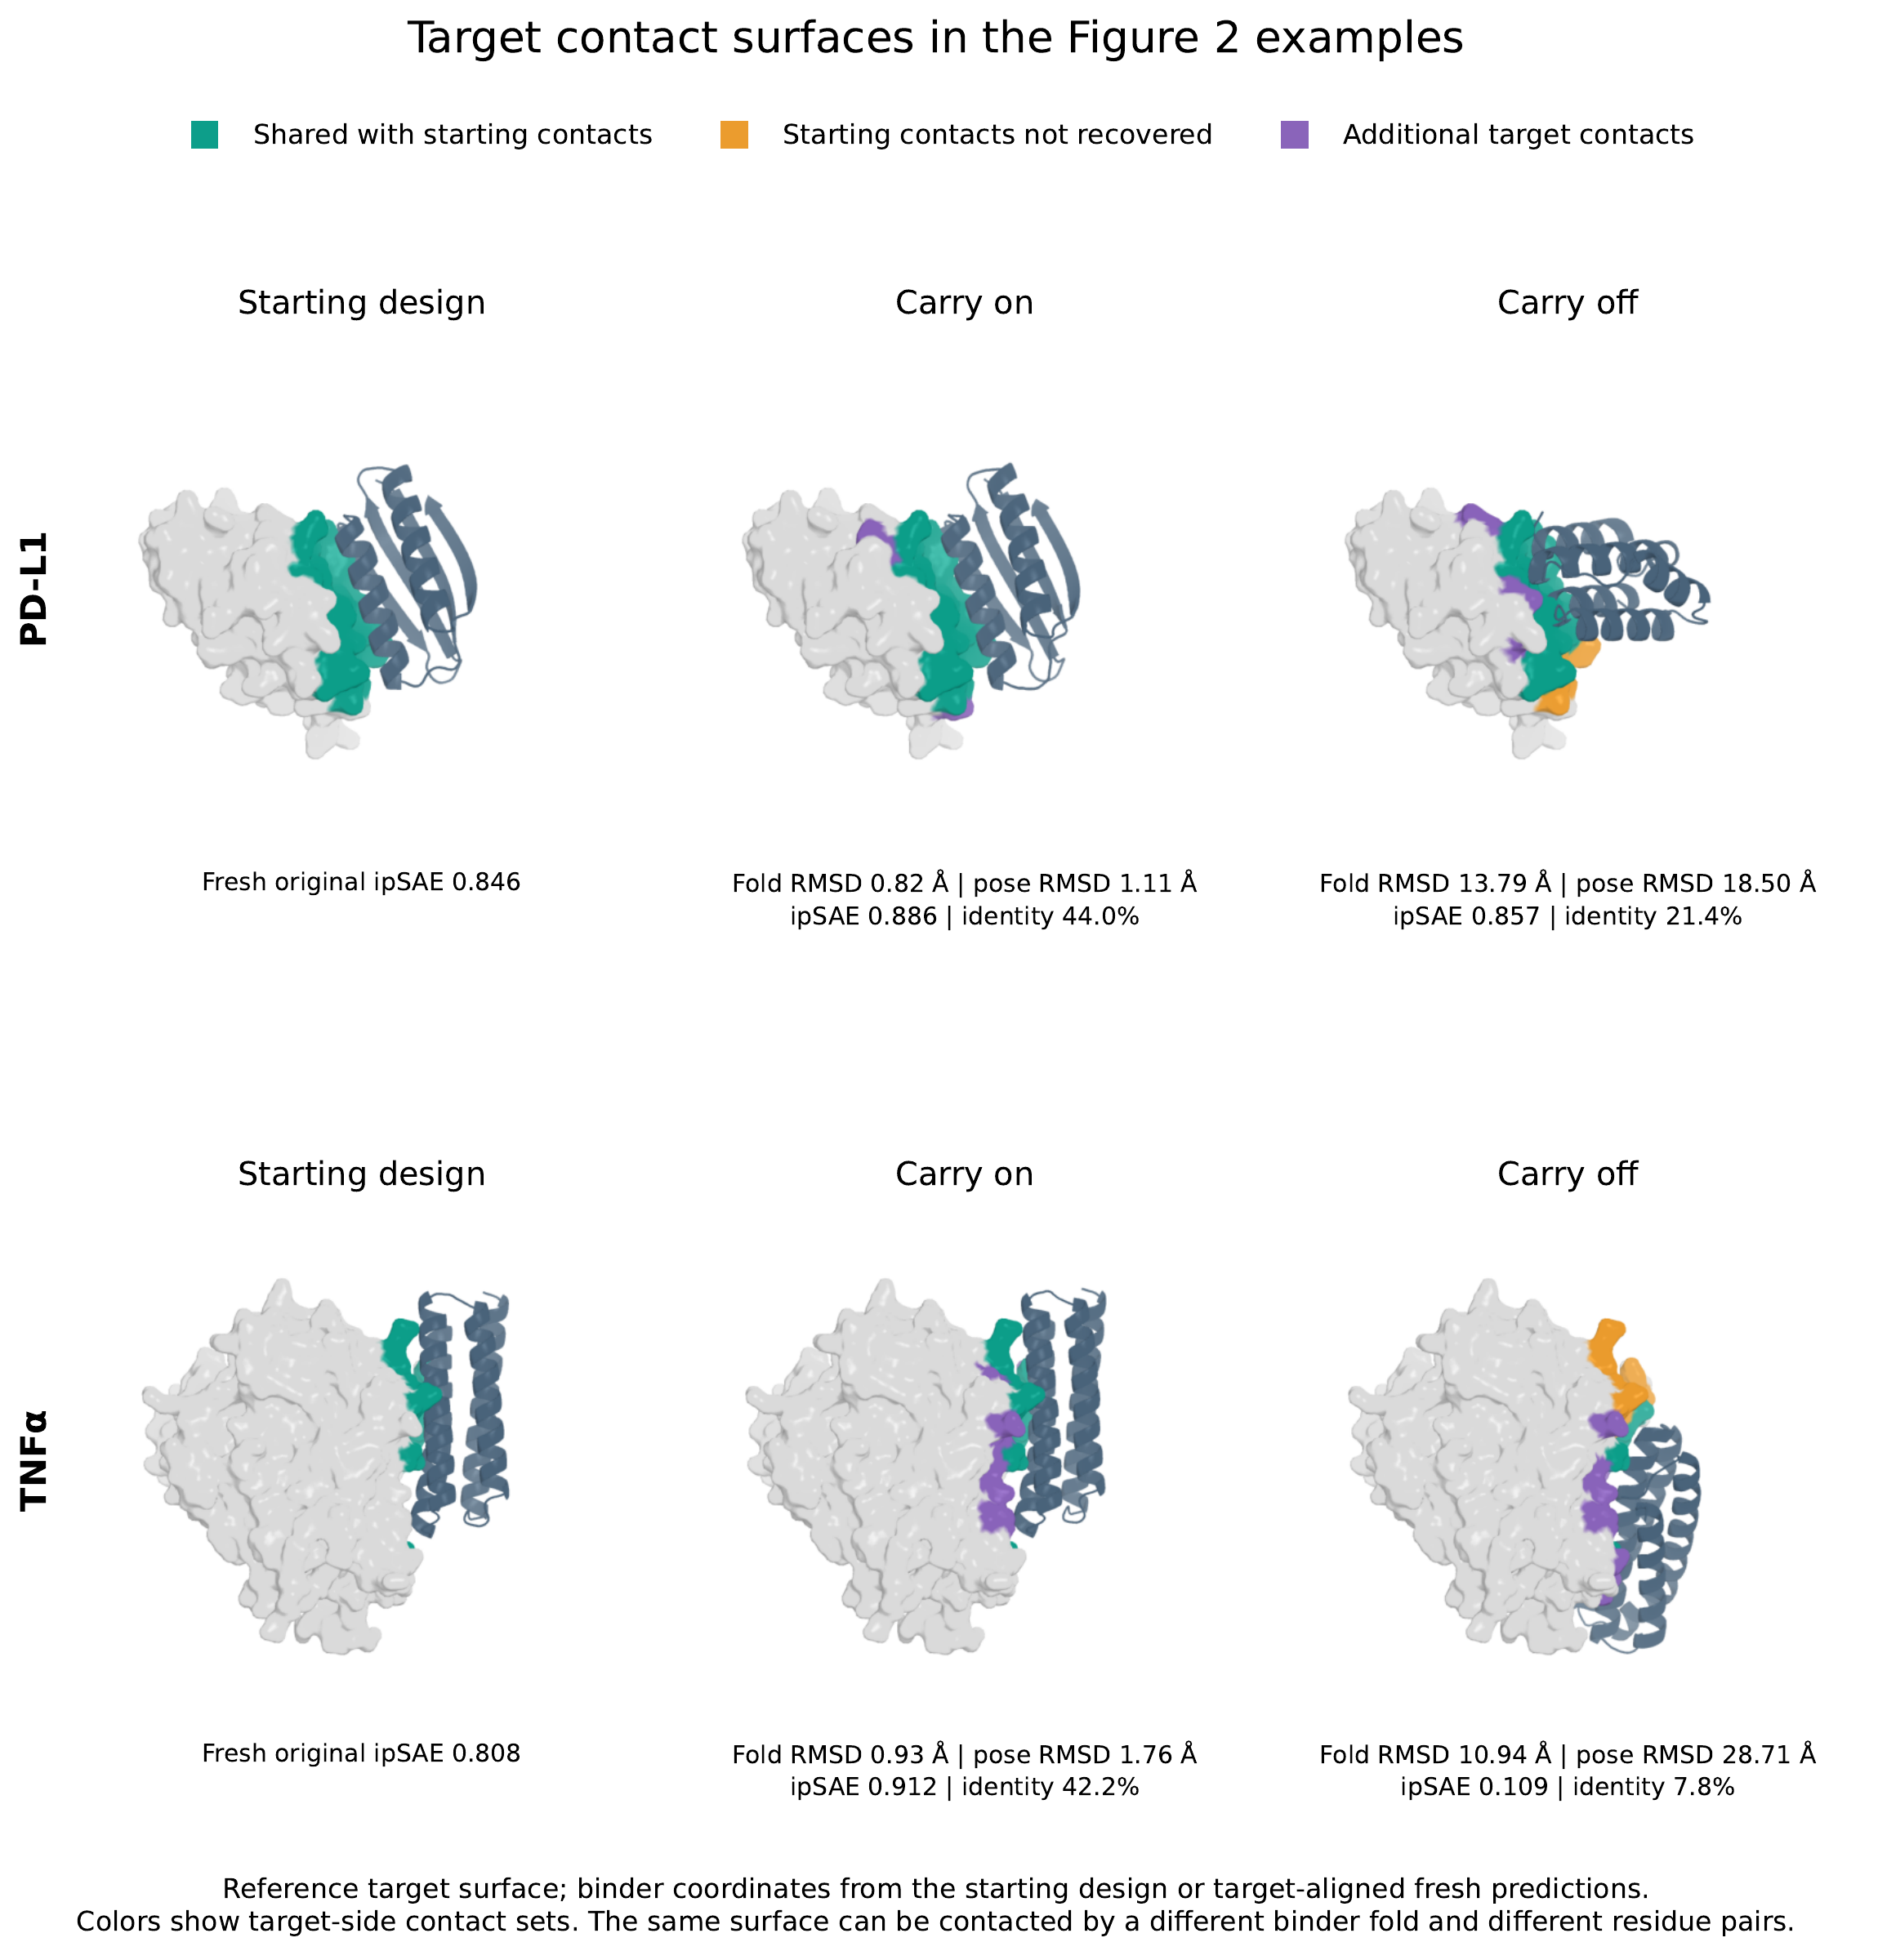
Do the designs stay where they were placed? We measured interface retention as contact recall, the fraction of the starting binder–target residue-pair contacts that a fresh prediction recovers. With carryover, 45 of 60 PD-L1 and 23 of 60 TNF designs reached a contact recall of at least 0.5 in fresh Boltz-2 predictions, whereas none of the 60 carry-off designs for either target did (Fig. 2C,D). Mean contact recall was 0.553 with carryover versus 0.021 without it for PD-L1, and 0.330 versus 0.012 for TNF. Without carryover, the predictions still contact a substantial part of the original target surface, but through different binder residues (Supplementary Fig. S2).
The interfaces survived large changes to the binder sequence: on average, 64% of the binder residues changed for PD-L1 and 67% for TNF. The binder folds also stayed close to the starting folds: mean TM-scores of the superposed binder [18] in fresh Boltz-2 predictions were 0.871 and 0.831, compared with 0.266 and 0.257 without carryover.
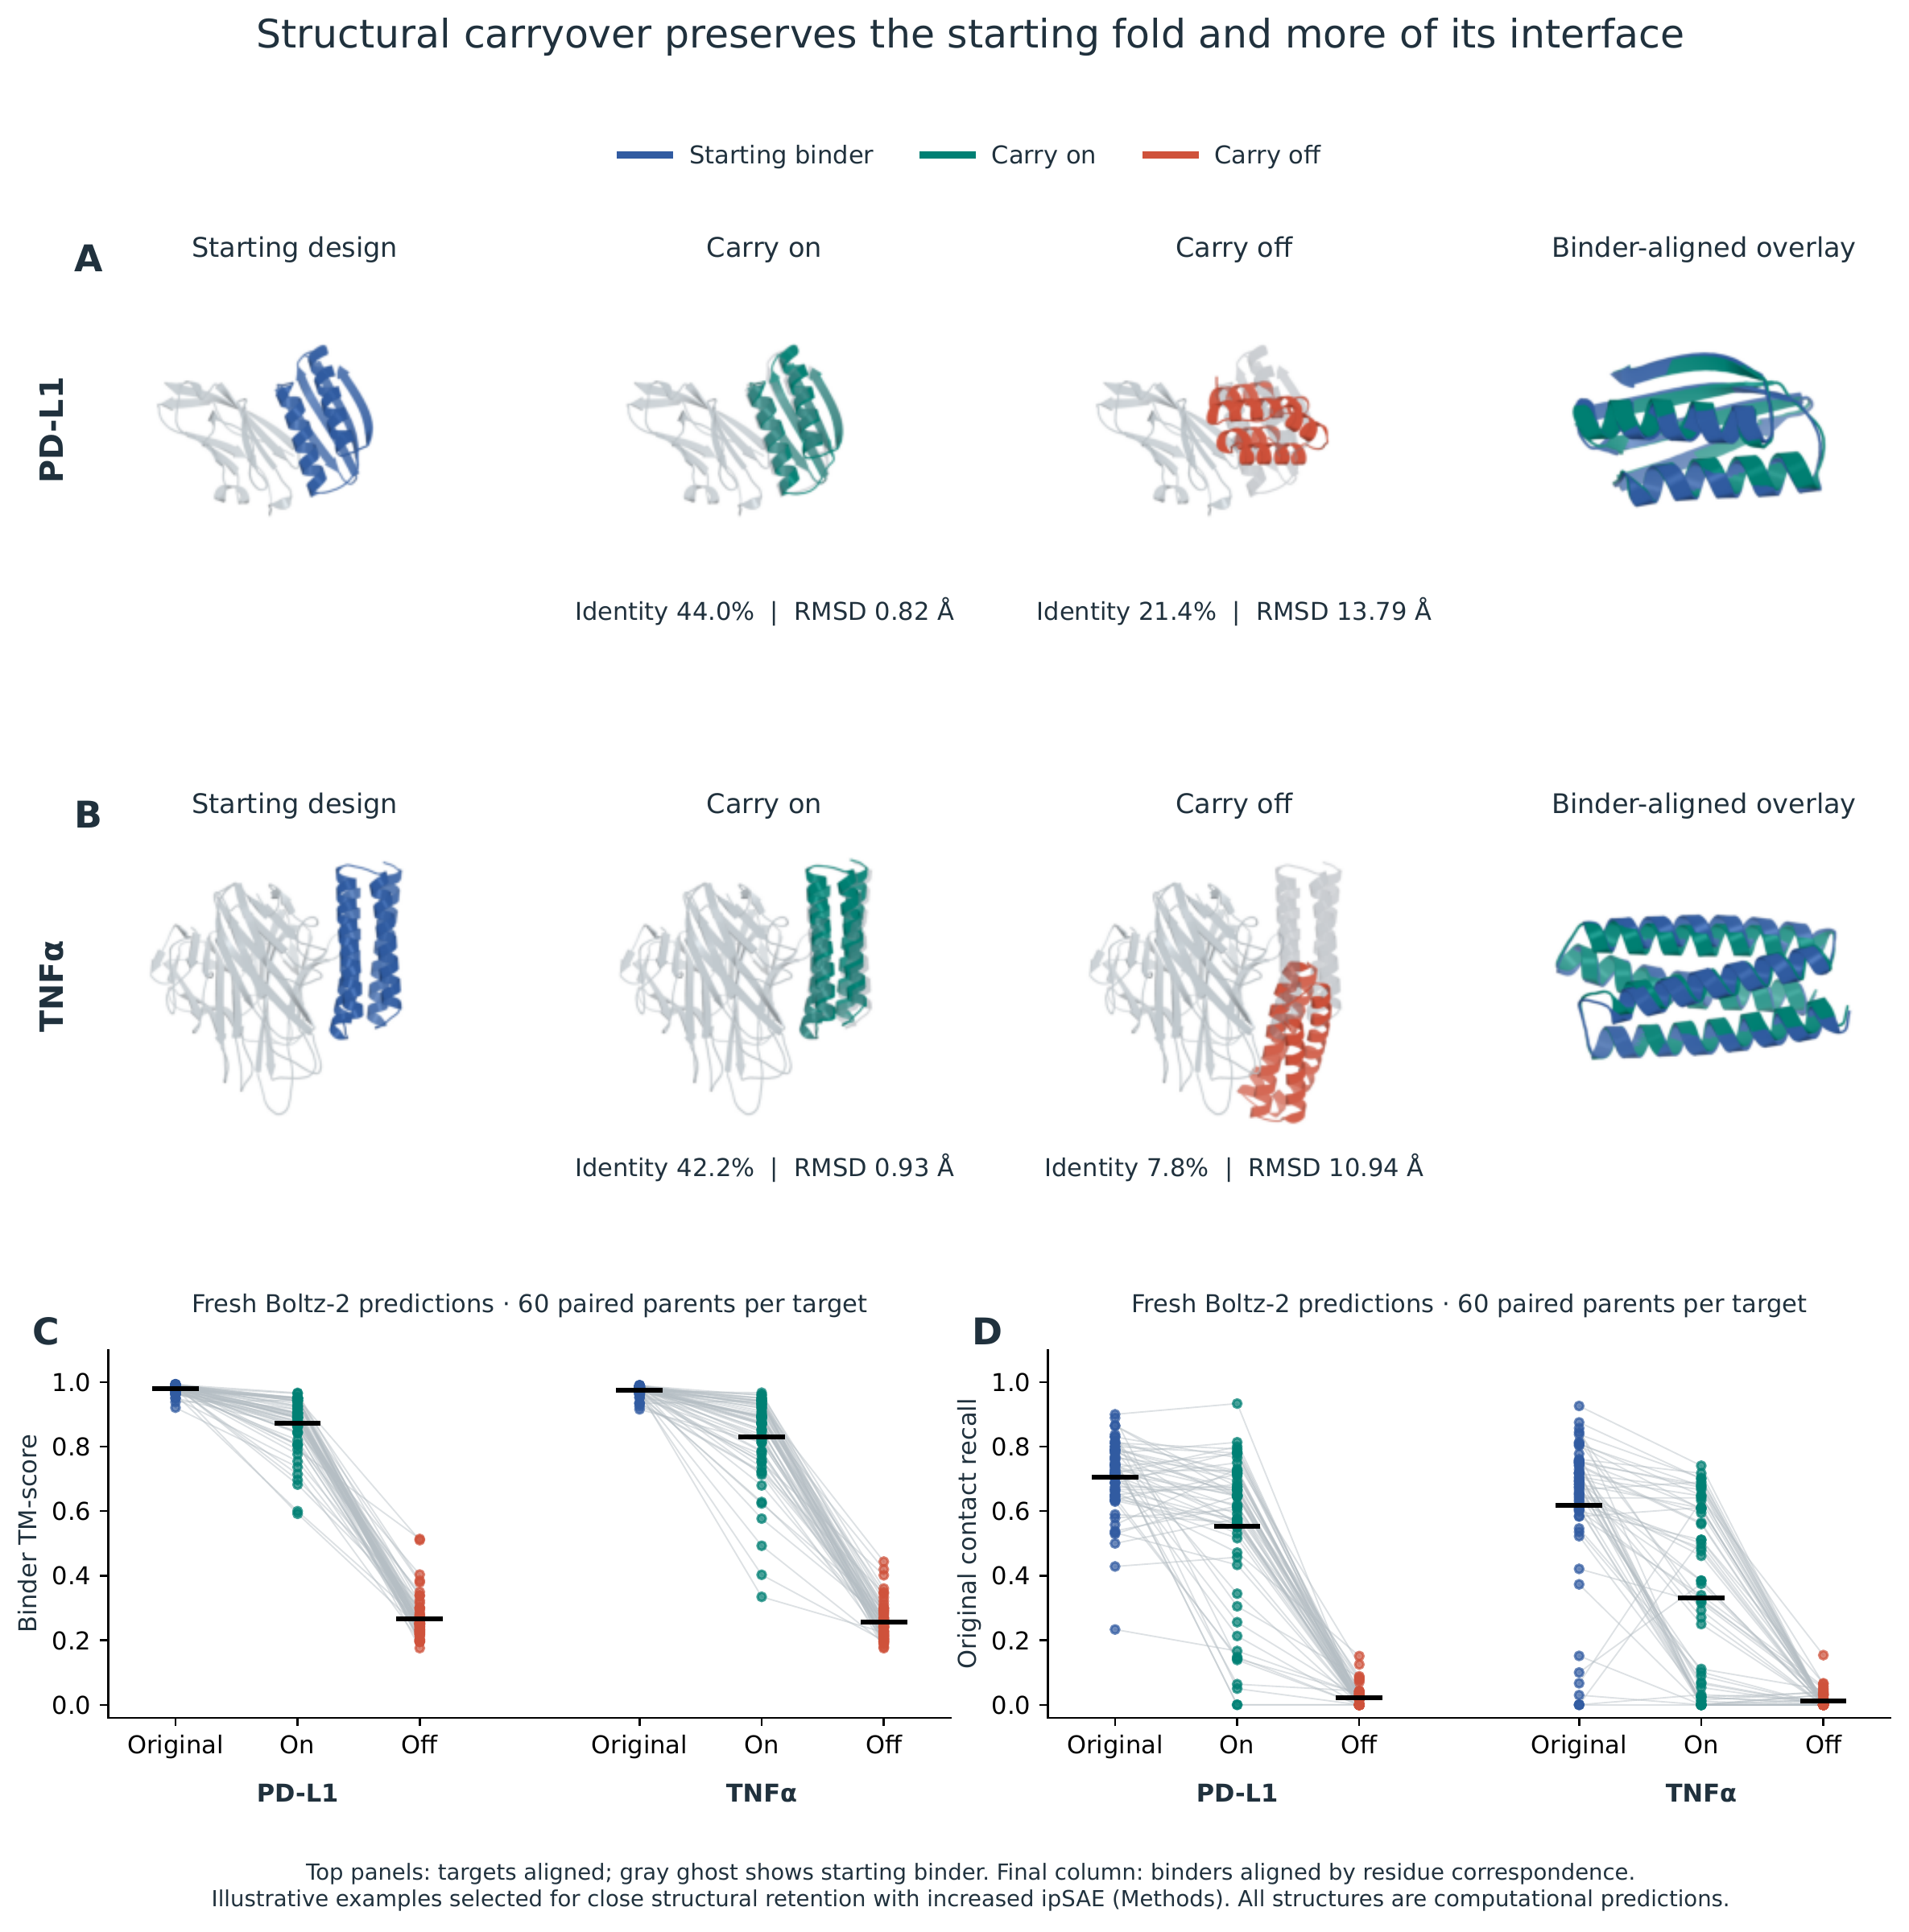
Figure 2A,B shows one example for each target, selected to illustrate close retention of both fold and placement. Both examples retain only 44.0% and 42.2% sequence identity to the starting design, yet their binder C RMSDs are 0.82 and 0.93 Å and their target-aligned binder RMSDs are 1.11 and 1.76 Å. Fresh Boltz-2 ipSAE rises from 0.846 to 0.886 for the PD-L1 example and from 0.808 to 0.912 for the TNF example. The paired distributions in Figure 2C,D show all 60 designs per target.
Confidence improvements extend across prediction models
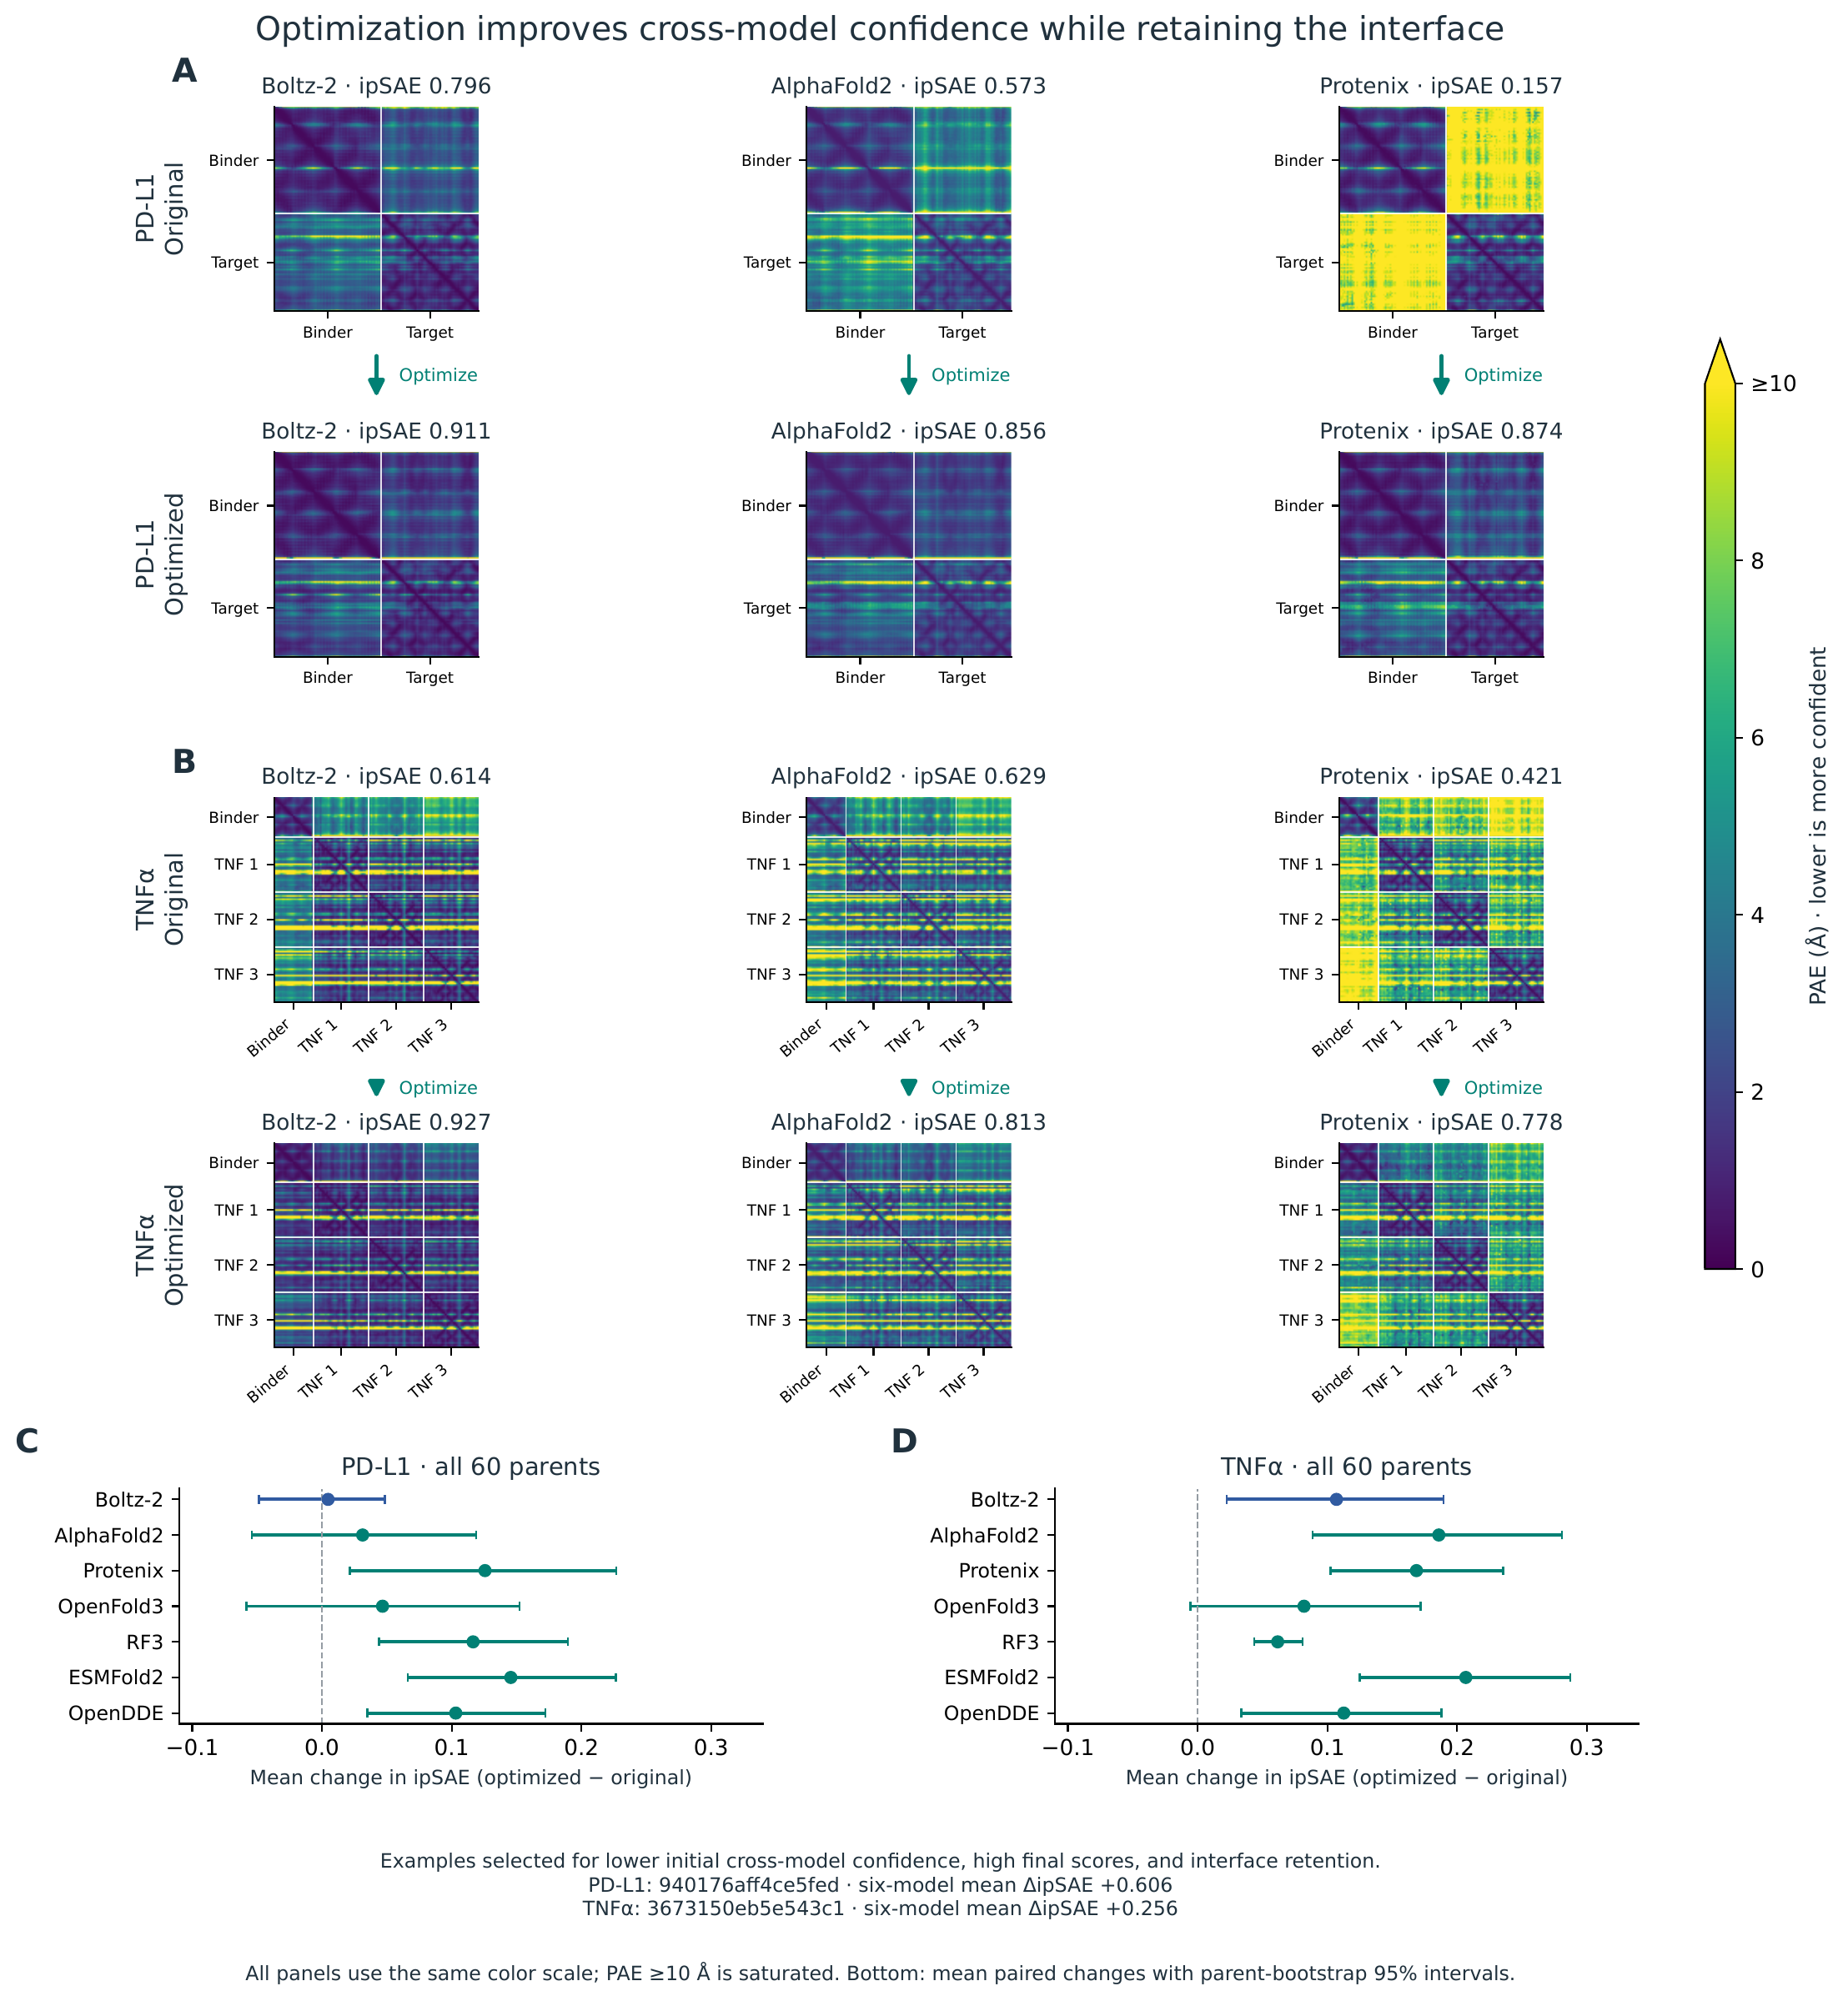
Next, we asked whether carry-on sequences also gain confidence in predictors other than Boltz-2. Boltz-2 supplied the gradients for the sequence updates, so its own confidence scores could simply reflect them. Models that supplied no gradients give a cleaner test. We therefore predicted the original and carry-on sequences again with Boltz-2 and with six other models: AlphaFold2, Protenix, OpenFold3, RF3, ESMFold2 and OpenDDE [19,20,21,22,23,24,25]. We scored each predicted complex with PAE-derived ipSAE [26] and compared every carry-on sequence with its starting sequence.
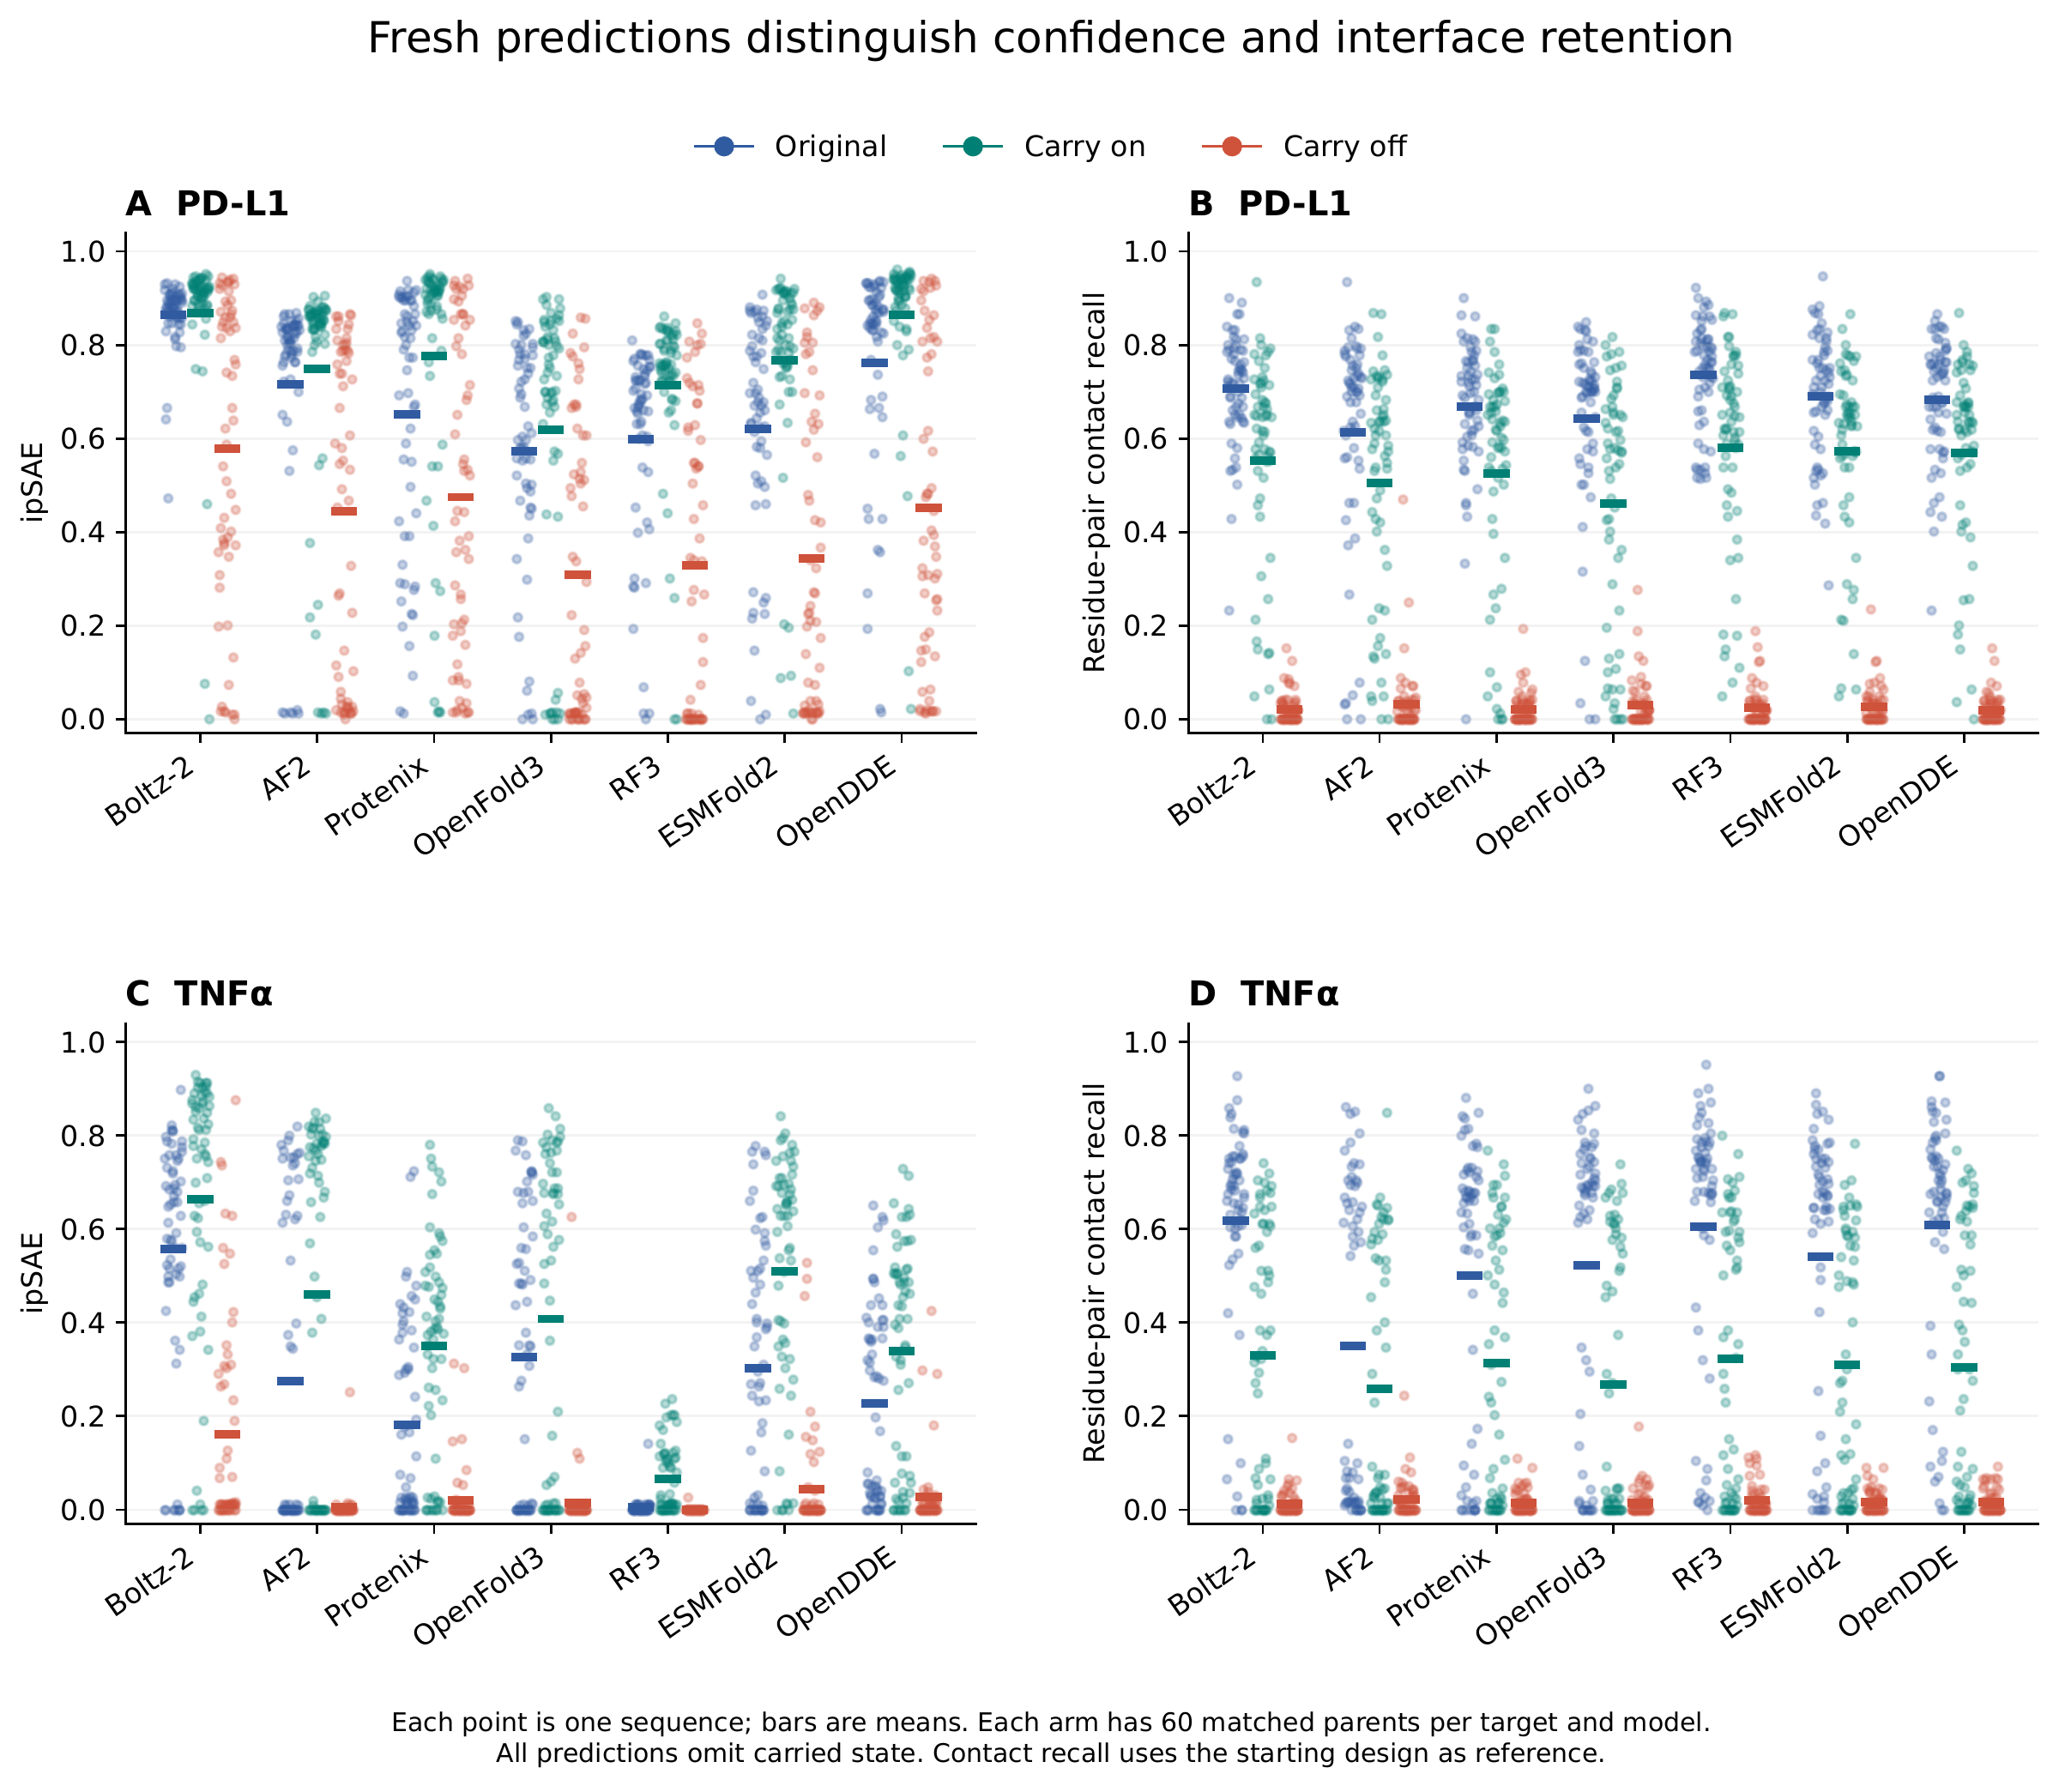
Scored this way, the carry-on sequences had higher mean ipSAE than their starting sequences in all six other models, so the improvement is not specific to Boltz-2 (Fig. 3C,D). Pooled over these models and both targets (720 predictions per arm), median ipSAE rose from 0.49 to 0.69, and mean ipSAE rose from 0.44 to 0.55. In 71% of the paired predictions, the carry-on sequence scored higher than its starting sequence. The gain was larger for TNF, whose starting designs scored far lower. Before optimization, 37% of their predictions had an ipSAE of exactly zero; after optimization, 20% did (360 predictions per arm: 60 designs 6 models). Median ipSAE rose from 0.03 to 0.37 for TNF and from 0.75 to 0.84 for PD-L1. Boltz-2 itself changed little for PD-L1 (+0.005), as expected because the starting designs had been ranked on Boltz-2 interface confidence.
We also used the same six models to check the interface retention reported above. In the other predictors, 35–46 of 60 PD-L1 carry-on designs and 20–26 of 60 TNF carry-on designs kept at least half of the starting residue-pair contacts, compared with 0 of 60 carry-off designs in every model and target (Supplementary Fig. S1). In many designs, retention and confidence gain occurred together: of the 60 designs per target, 33 PD-L1 designs and 20 TNF designs kept at least half of their starting contacts and also raised mean ipSAE across the six other predictors.
Figure 3 shows two selected designs with large confidence gains. Both started with low cross-model confidence, reached high scores after optimization and kept their interfaces. In the PD-L1 example, Protenix ipSAE rose from 0.157 to 0.874, and in the TNF example it rose from 0.421 to 0.778. Boltz-2 and AlphaFold2 also improved in both examples, and fresh Boltz-2 predictions retained 75% and 70% of the starting contacts, respectively.
The optimization and selection workflow yields more confirmed binders
Do the optimized designs bind more often than unoptimized designs? For each target, we independently selected ten unoptimized and ten optimized sequences, using the same five-model consensus score for both sets (Fig. 1B). We sent both sets to Adaptyv Bio for binding measurements by biolayer interferometry (BLI).
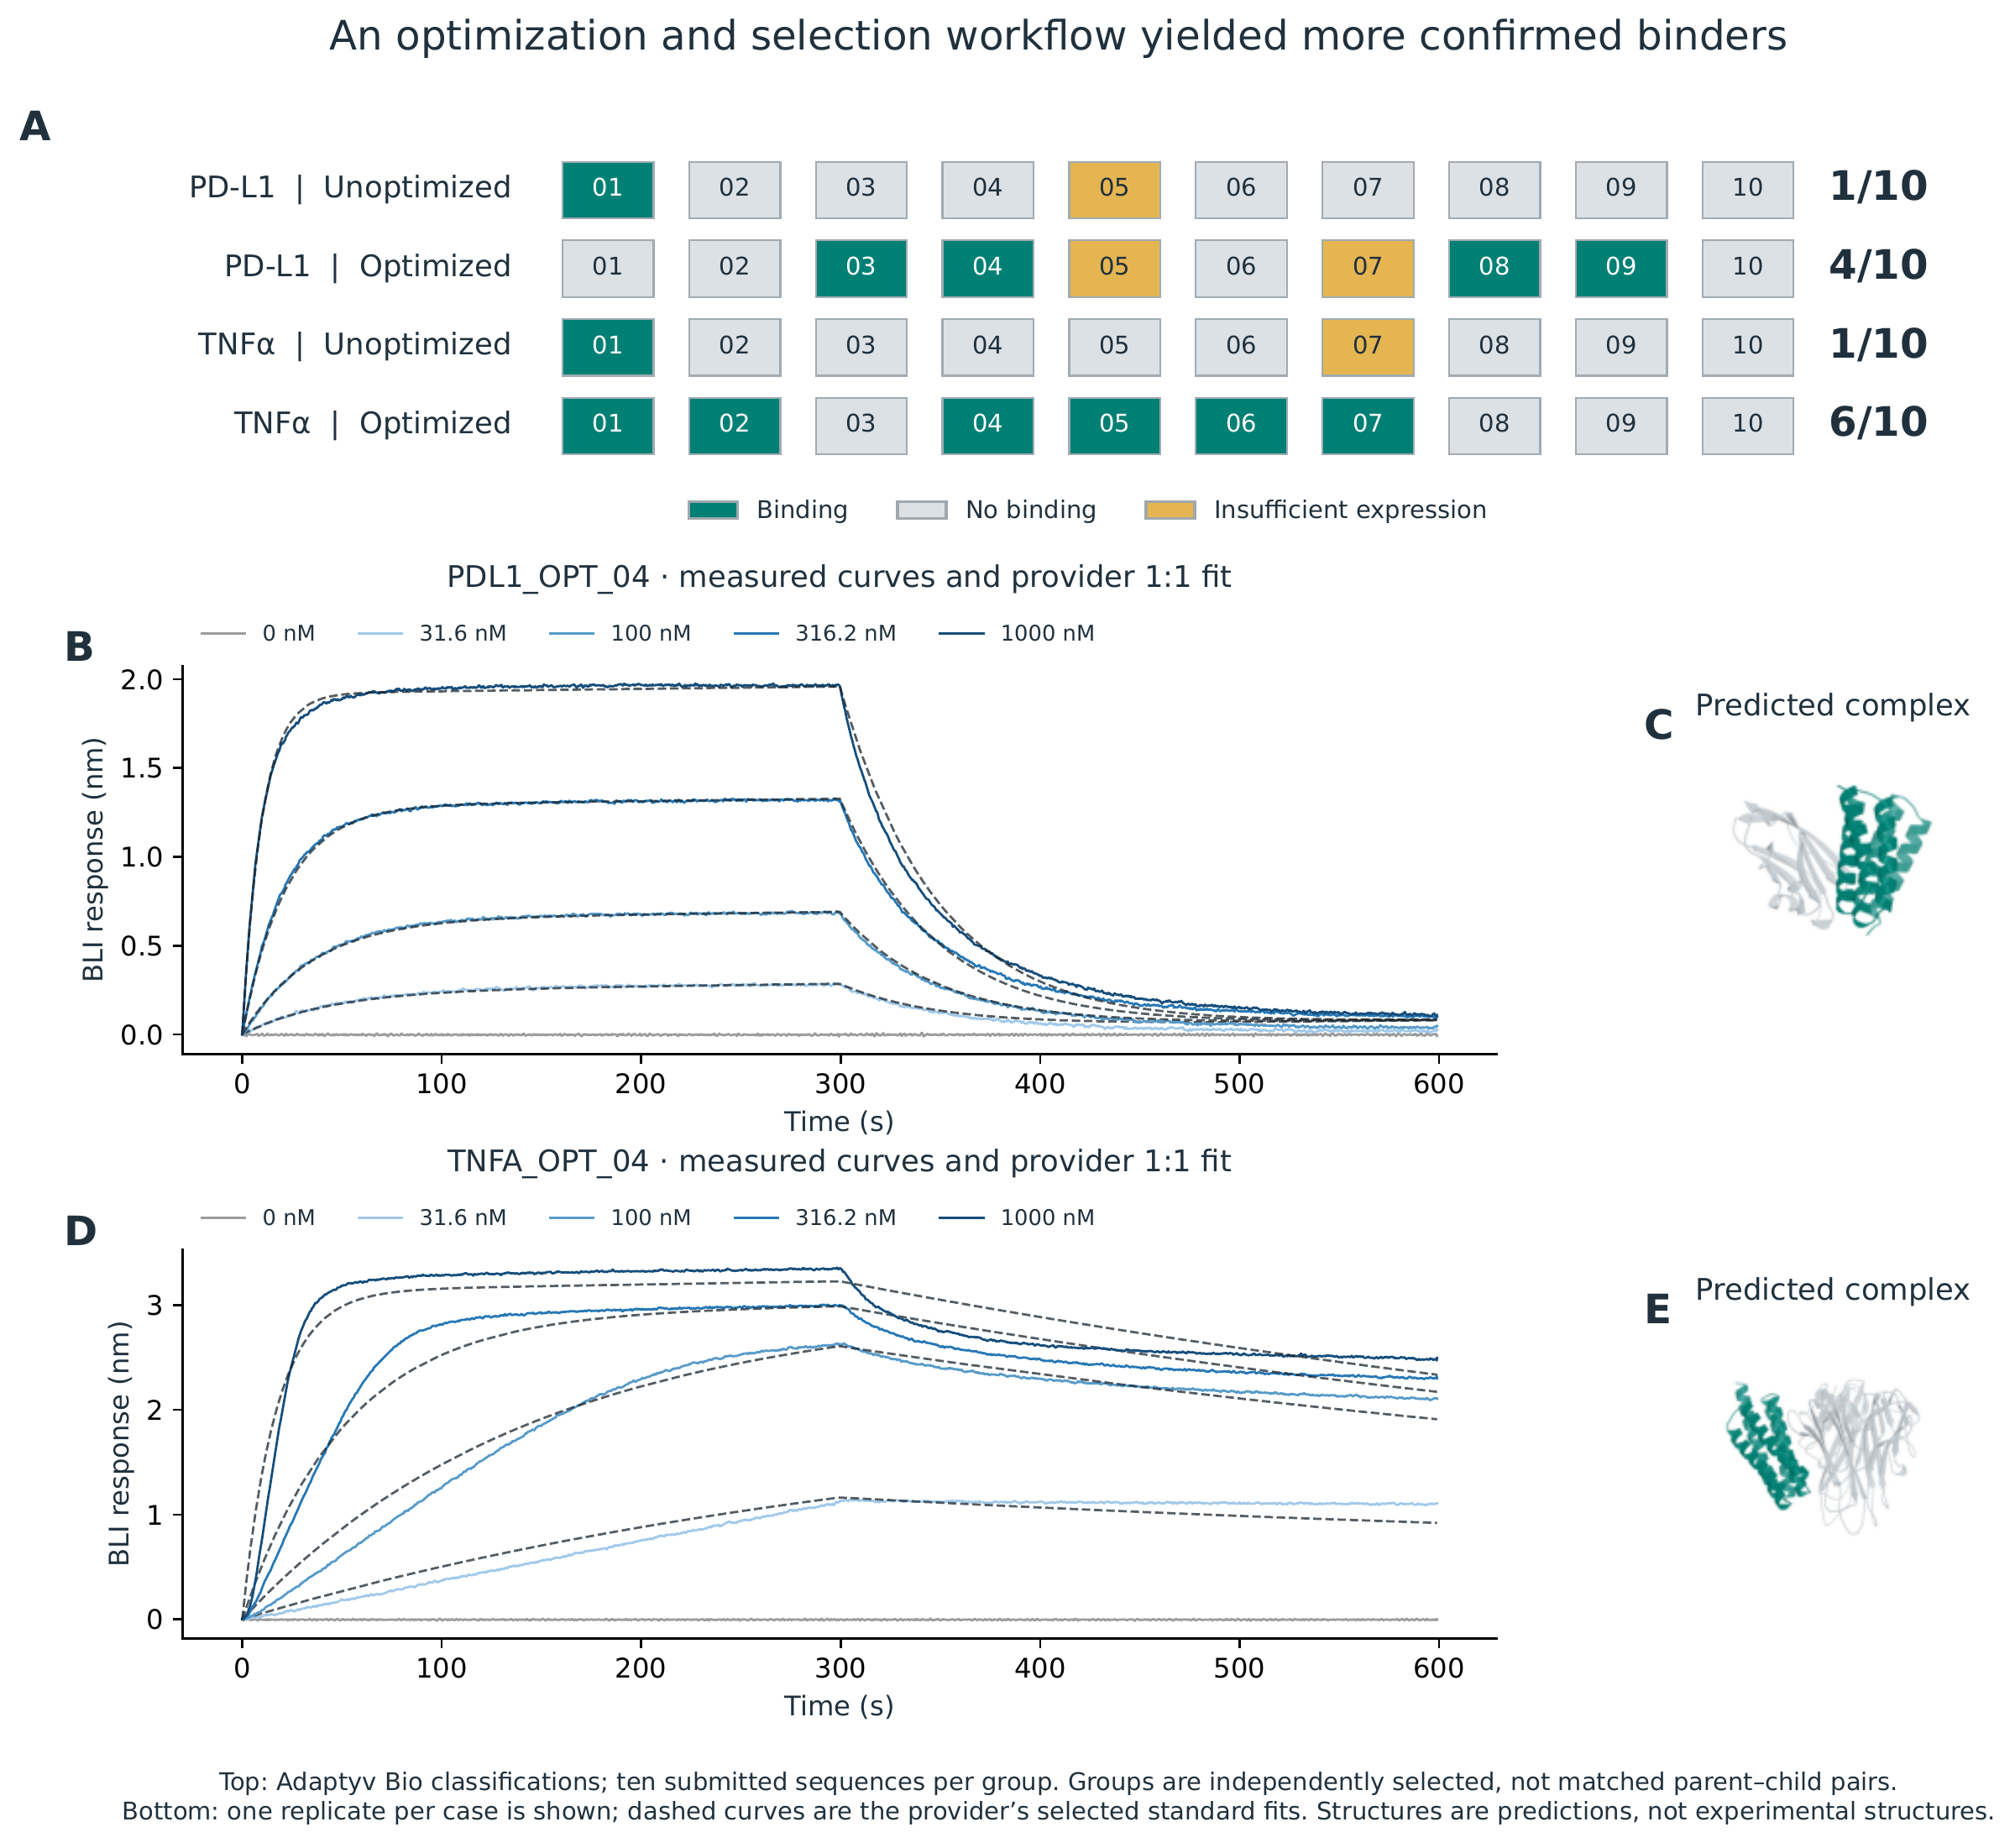
The optimized sets contained more confirmed binders: six of ten optimized TNF designs and four of ten optimized PD-L1 designs were confirmed as binders by BLI, compared with one of ten in each unoptimized set (Fig. 4A; Supplementary Tables S1 and S2).
The confirmed binders include PDL1_OPT_04 and TNFA_OPT_04, which show concentration-dependent BLI responses, with provider-reported apparent dissociation constants of 309 nM and 13.2 nM, respectively (Fig. 4B–E).
Carryover can also retain protein–DNA and protein–small-molecule arrangements in computational tests
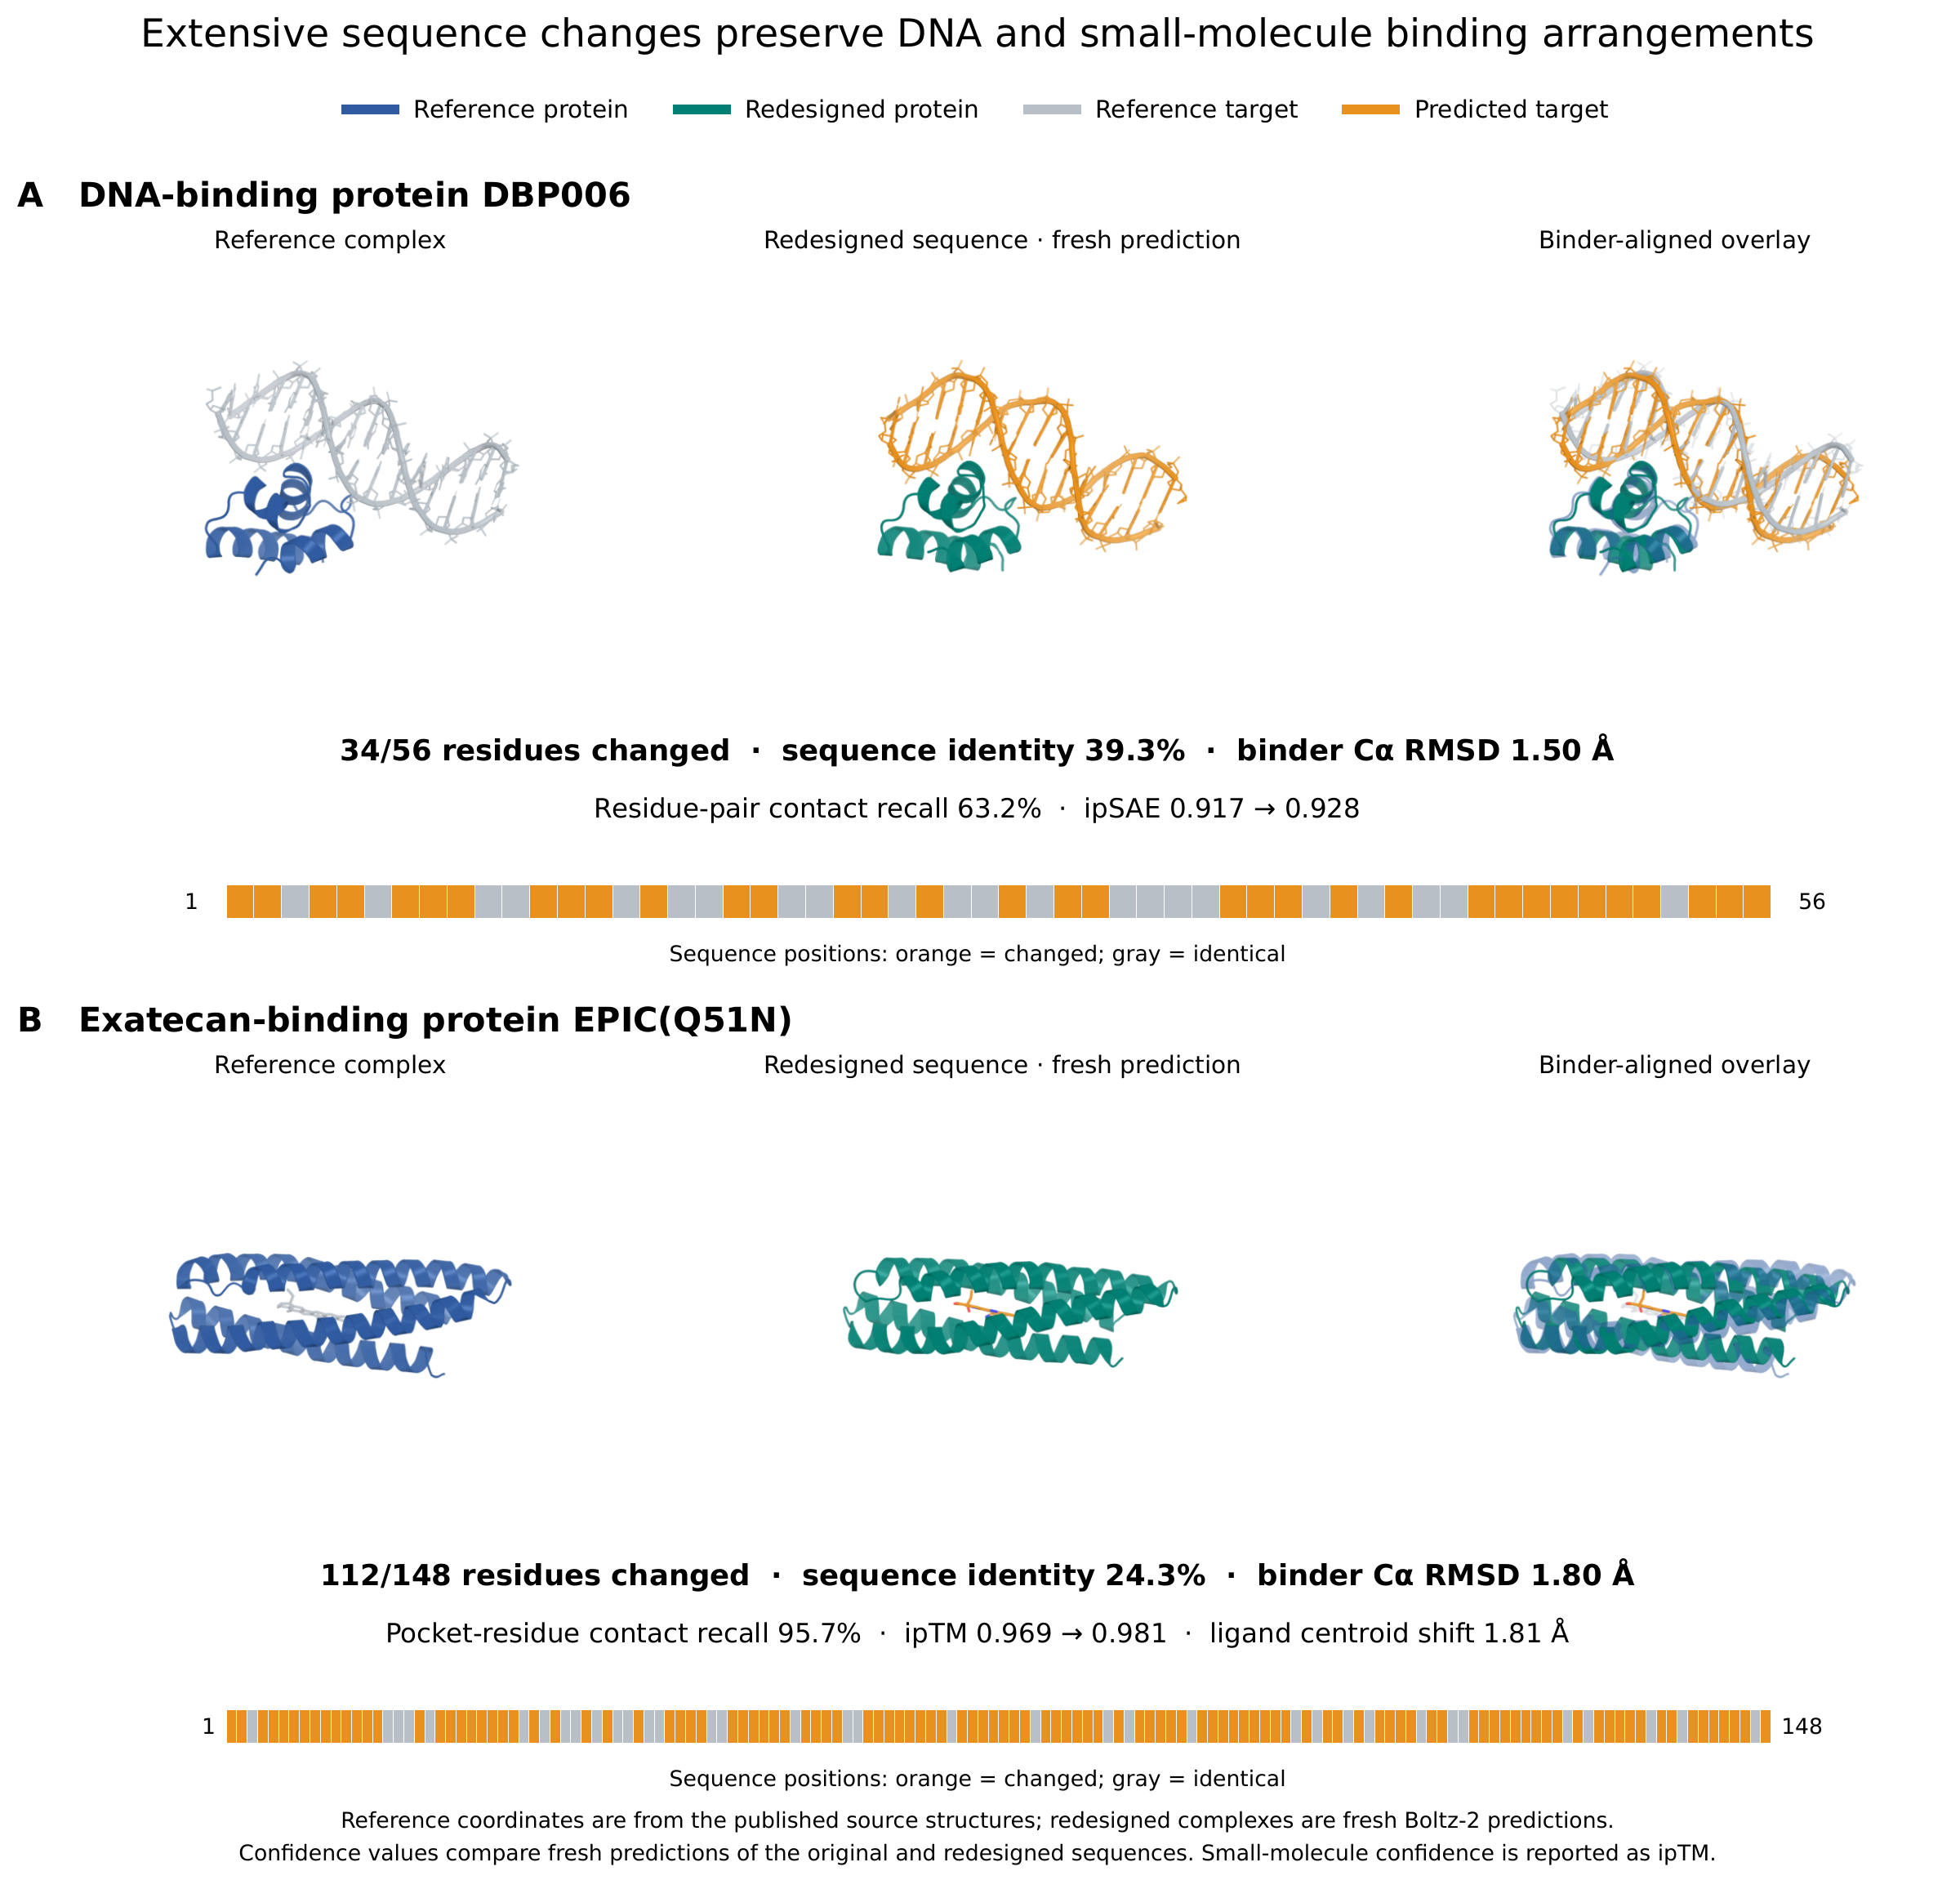
Finally, we tested carryover outside protein–protein binding, on protein–DNA and protein–small-molecule complexes (Supplementary Fig. S3). Starting from published binders, we optimized the protein sequences with and without carryover. We then predicted each resulting sequence again with Boltz-2, without the carried state, and asked whether the starting arrangement survived the sequence changes.
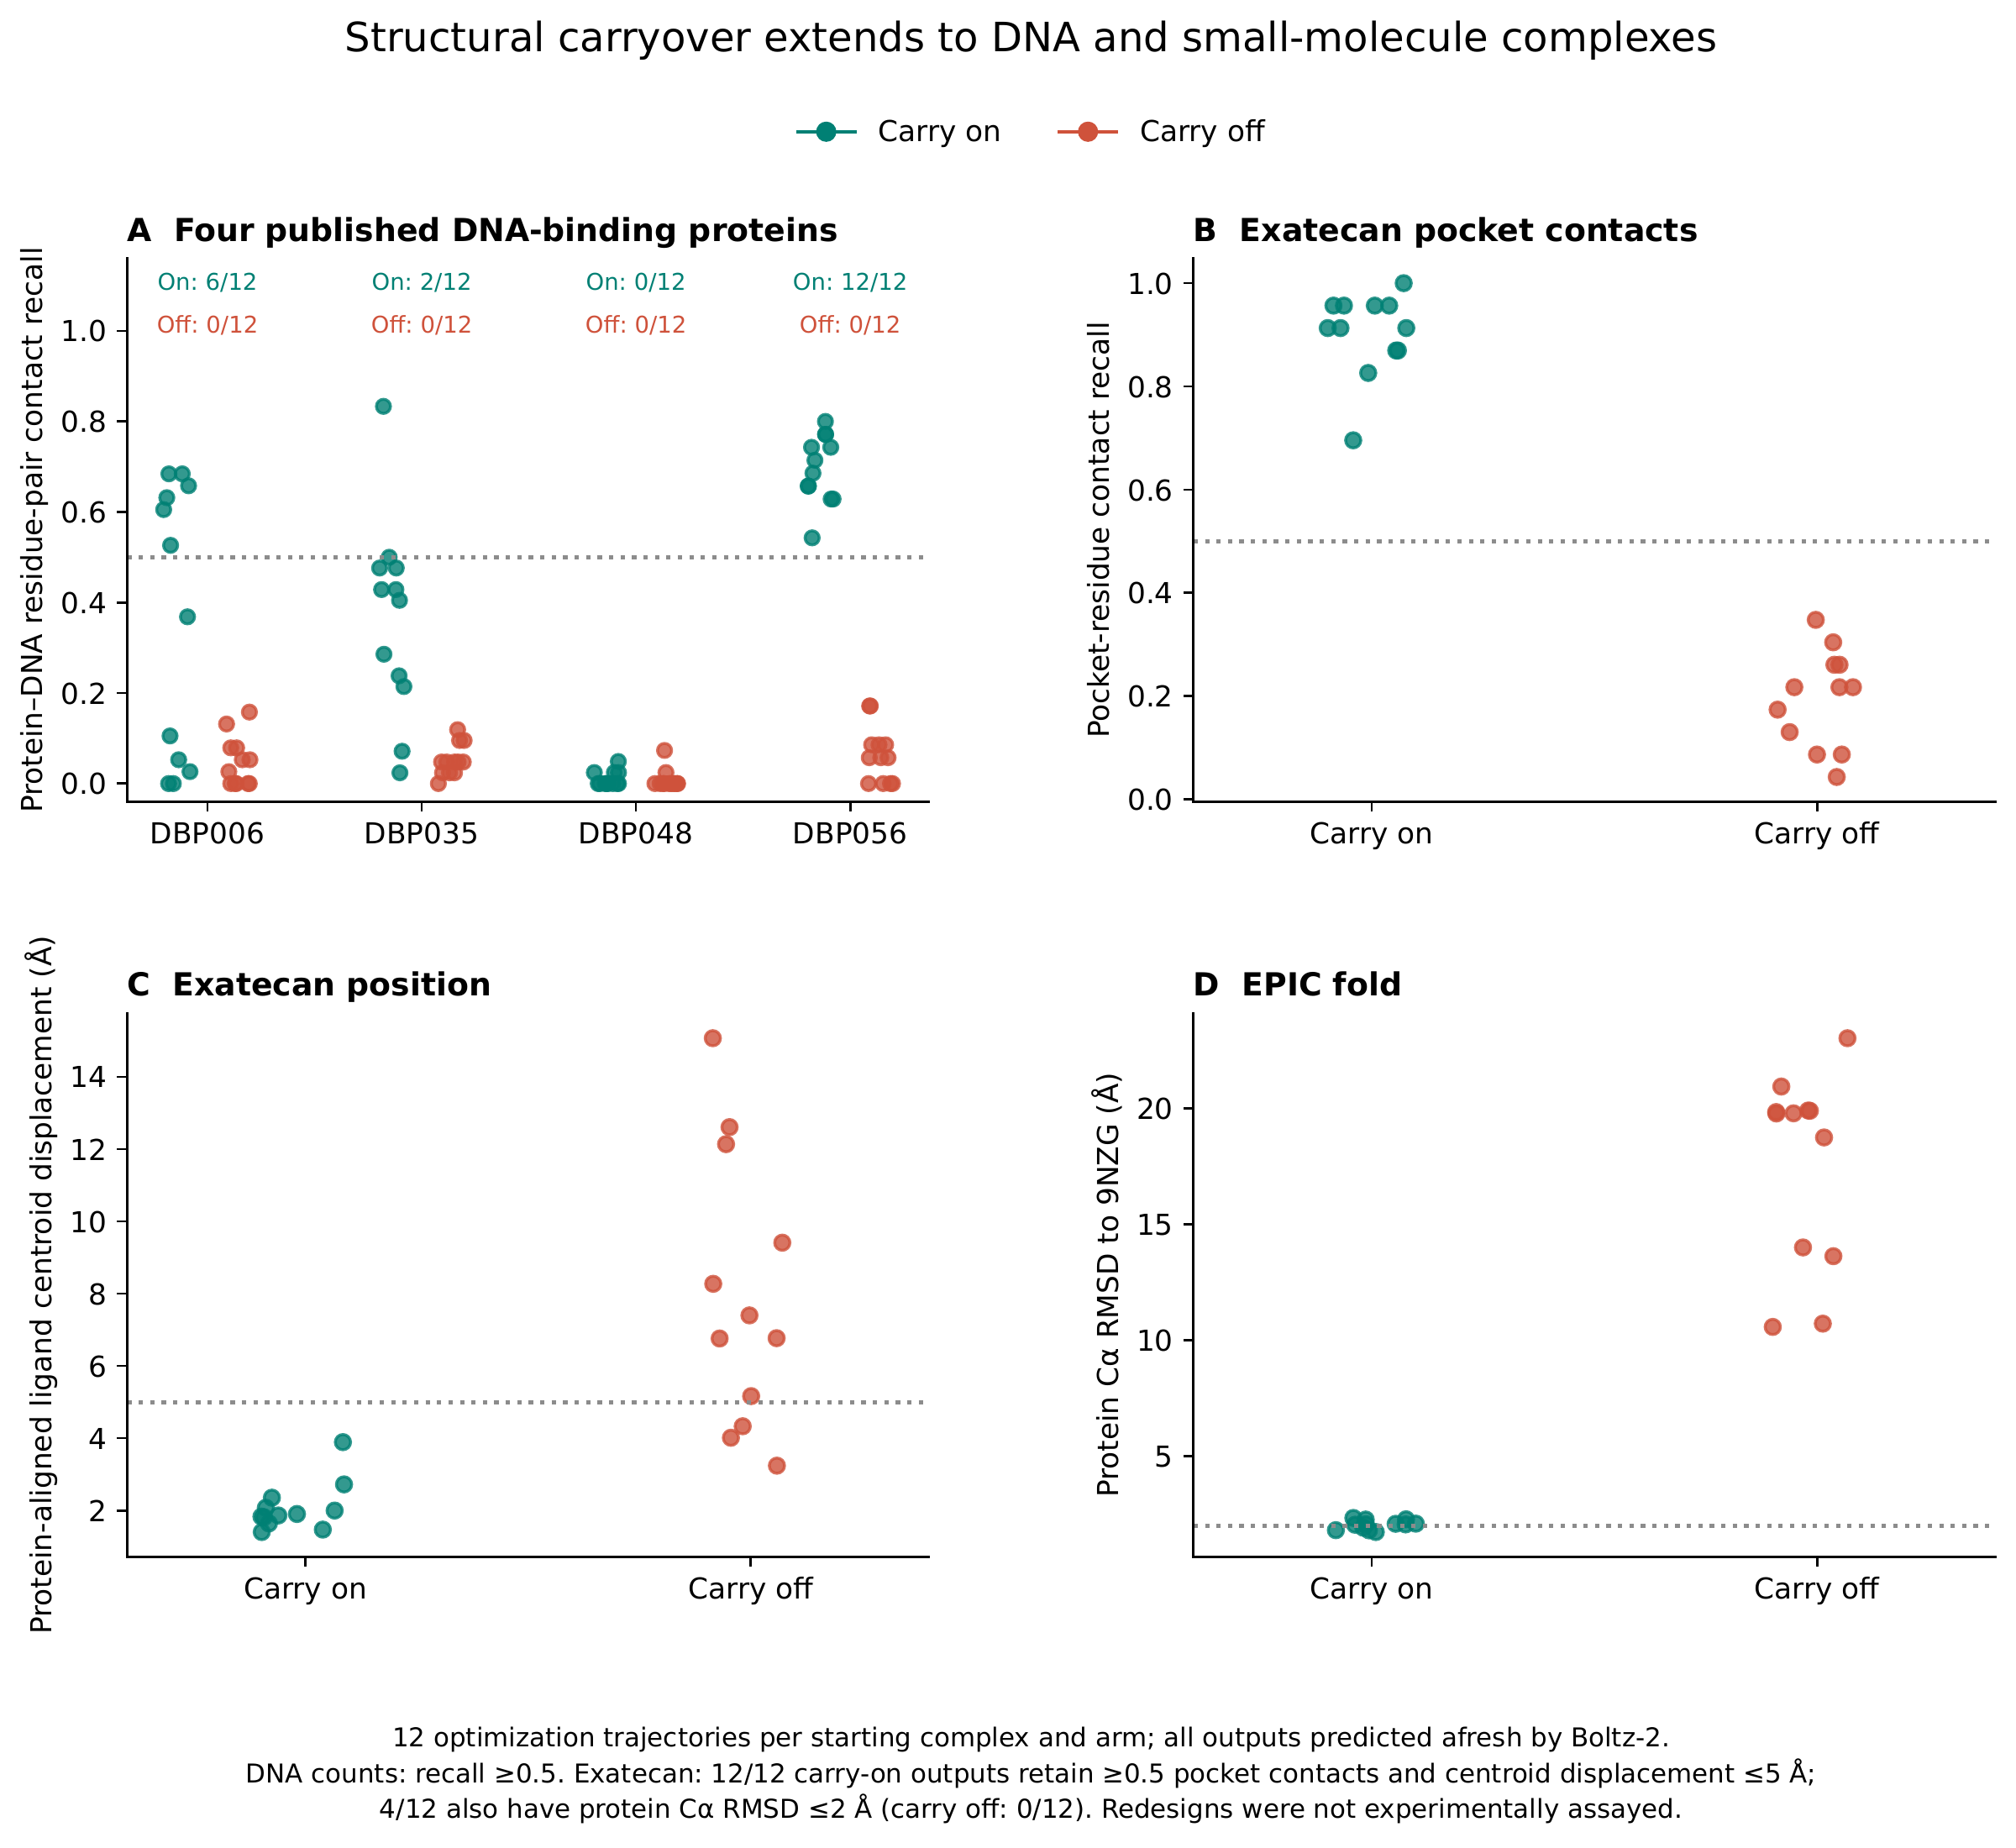
For DNA, we started from four published DNA-binding proteins: DBP006, DBP035, DBP048 and DBP056 [27]. Fresh Boltz-2 predictions kept at least half of the starting protein–DNA residue-pair contacts in 12 of 12 DBP056, 6 of 12 DBP006, 2 of 12 DBP035 and 0 of 12 DBP048 carry-on trajectories, compared with 0 of 12 for each carry-off control.
For a small molecule, we started from the exatecan-binding protein EPIC(Q51N) [28]. All 12 carry-on outputs kept at least half of the starting pocket-contact residues and placed the ligand centroid within 5 Å of its reference position after protein alignment, whereas no carry-off output met both criteria. Four carry-on outputs also kept the protein C RMSD within 2 Å.
Two examples show that the molecular arrangement survives extensive sequence changes (Supplementary Fig. S5). A DBP006 redesign changes 34 of 56 residues, yet it has a protein C RMSD of 1.50 Å and retains 63% of the starting protein–DNA contacts. Its fresh-prediction ipSAE is 0.917 for the original sequence and 0.928 for the redesign. An EPIC(Q51N) redesign changes 112 of 148 residues and has a protein C RMSD of 1.80 Å, retains 96% of the starting pocket-contact residues and moves the ligand centroid by 1.81 Å. Its fresh-prediction ipTM changes from 0.969 to 0.981. Both redesigns also keep high interface confidence.
Together, these tests show that carryover is not limited to protein–protein interfaces. In both protein–DNA and protein–small-molecule complexes, carry-on redesigns could keep the starting arrangement through extensive sequence changes, whereas carry-off redesigns did not. Carryover can therefore be used to redesign the sequence of an existing DNA- or small-molecule-binding protein while keeping its predicted binding arrangement.
Discussion
Using ArcRefine to pass Boltz-2’s internal representations from one sequence update to the next, we rewrote about two-thirds of the residues of generated PD-L1 and TNF binders, and many of the rewritten designs kept their starting interface in fresh predictions. Other predictors also scored the optimized designs higher than the starting designs. In experiments, six of ten optimized TNF designs bound, against one of ten unoptimized candidates. AlphaProteo, PXDesign, BoltzGen and Complexa each tested designs against TNF and obtained no binders in experiments [9,5,6,29].
Why other predictors also score the optimized designs higher is not yet settled. One candidate is the inverse-folding term, which favors sequences compatible with the predicted structure and may limit solutions that exploit Boltz-2 without encoding a reproducible fold; an ablation of this term would test it.
Other methods also keep structural information while a sequence changes, but they carry it in different forms. Inverse folding with ProteinMPNN fixes the backbone and designs sequences onto it [30], so the structure cannot adapt to the new sequence. Coordinate-based refinement, as in HalluDesign, carries molecular coordinates into structural sampling [31]. ConforNets learns transforms of a predictor’s internal representations to change the predicted conformation [32]. Carryover instead reuses the predictor’s own internal representations from the previous prediction, without supplied coordinates or a trained transform.
In the Complexa study, Generate & Hallucinate refines a generated sequence with BindCraft [7]. Its main configuration changes the sequence only by random mutations that are kept when they improve the loss; adding gradient-based optimization was not universally helpful, and the authors note that hallucination can only modify a potentially flawed initial sample [7]. Carryover lets gradient-based optimization move far from the generated sequence without leaving its binding mode: about two-thirds of the residues changed, and many designs kept the starting interface, whereas the same optimization without carryover kept it in none of the 60 designs per target. On TNF, Complexa’s search reached 15 in silico successes after 475 GPU hours [7], and its wet-lab screen found no on-design binder [29], whereas six of ten designs optimized with carryover bound in experiments. Our entire TNF campaign, from generation through optimization and final checks, used about 300 GPU hours on A100 and A10G GPUs (Methods).
Carryover is not tied to protein targets, to Boltz-2 or to a confidence-only objective. The protein–DNA and protein–small-molecule tests show that the operation applies to other target types. Hallucination through Protenix has been run in Mosaic [33], so carrying Protenix’s representations in the same way is a direct extension. The carryover operation can be combined with different differentiable objectives. For example, terms that favor binding to the intended target and penalize binding to a related off-target could guide sequence optimization toward greater selectivity while carryover preserves the intended binding mode.
Methods
Study design and computational cohorts
The main analysis comprised PD-L1 and TNF starting cohorts of 60 designs each. Starting designs were generated by a pipeline that combines four generative models: RFdiffusion3, BoltzGen (run as a JAX implementation), PXDesign and Complexa. Backbones from RFdiffusion3, BoltzGen and PXDesign were sequence-designed with ProteinMPNN, and Complexa generated sequences directly. Designs passed hotspot and steric-clash filters and were predicted with Boltz-2; those with ipsae_min above 0.4, binder RMSD to the generated design below 4 Å and a binder radius of gyration within 1.1 times the length-scaled expectation were ranked by ipsae_min, and the 60 top-ranked designs per target formed the main cohorts. The configured generation budgets were 300, 100, 350 and 250 designs for RFdiffusion3, BoltzGen, PXDesign and Complexa for PD-L1, and 1,000 designs per generator for TNF. These numbers describe requested generation budgets rather than verified counts of completed designs. The PD-L1 cohort contained 18, 35 and 7 designs from PXDesign, RFdiffusion3 and Complexa, respectively; the TNF cohort contained 33, 18 and 9. None came from BoltzGen. Two archived carry-on outputs were available per starting design. For the primary one-output comparison, the output with the lexicographically smaller artifact identifier was retained for each parent, without reference to its scores or experimental outcome. Each parent was paired with one newly computed carry-off output. The original sequence and the two optimized sequences were evaluated in the same fresh-prediction panel.
The carry-off reproduction followed the historical optimization objective and used the sequence from the final optimization update, as in the carry-on runs, but used a later vendored runtime. The archived comparison is therefore reported with its temporal provenance. Historical PD-L1 carry-on runs additionally enabled a hotspot-departure guard (8 Å threshold, three consecutive steps), whereas the later carry-off runs did not; the archive contains two completed carry-on outputs for each of the 60 parents. Both arms of the contemporaneous PD-L1 comparison enabled this guard. The separate contemporaneous PD-L1 comparison comprised two intended trajectories per parent and arm; 58 parents had two completed trajectories in both arms. In this comparison, carryover raised contact recall in the optimization outputs by 0.528 on average (parent-level bootstrap 95% interval, 0.483–0.570). This comparison is not pooled with the main fresh-prediction dataset. The unit of comparison for computational cohort statistics is the original parent design.
ArcRefine implementation and sequence optimization
ArcRefine was implemented within the sequence-optimization framework provided by Mosaic, using Boltz-2 as the differentiable structure predictor [34,13]. Mosaic performs hallucination-style gradient-based sequence optimization, and carryover is applied within this loop. Binder sequence optimization used randomly initialized sequence probabilities. Structural carryover was initialized with single and pair representations obtained from a Boltz-2 prediction of the original binder sequence and target, and these representations were refreshed across sequence updates. The carry-off condition omitted both state initialization and subsequent state transfer. This manipulation concerns the outer sequence-update loop rather than ordinary recycling within a prediction. The target sequence remains fixed, while the binder sequence is optimized under an objective built from two groups of terms: Boltz-2 structural confidence and contact terms, and the ProteinMPNN-derived inverse-folding sequence-recovery loss supplied by Mosaic [30,35], which favors sequences compatible with the current predicted structure.
Fresh structure prediction and interface confidence
Each original, carry-on and carry-off sequence was independently predicted by Boltz-2, AlphaFold2-Multimer, Protenix-v2, OpenFold3, RF3, ESMFold2 and OpenDDE implementations [19,20,34,21,22,23,24,25]. AlphaFold2-Multimer and Protenix-v2 are denoted AlphaFold2 and Protenix in the figures. OpenFold3 follows the AlphaFold3 architecture [36,22]. These evaluations did not receive carried state or target templates from the optimization trajectory. One prediction was evaluated for each model–sequence combination. The model names identify the underlying prediction systems; several were accessed through JAX implementations. Multiple prediction systems were used in historical candidate screening; the six other predictors were not gradient objectives, and are evaluated here as cross-model corroboration.
For the reported interface-confidence comparisons, ipSAE was calculated from saved PAE arrays using the DunbrackLab definition [26]. A 10 Å PAE cutoff was used. The reported complex score is the larger directional score for a binder–target chain pair; for the TNF trimer, the largest binder–target-chain score is used. This summary does not imply uniformly high confidence across every chain or interchain region. The starting designs were ranked by the historical Boltz-2 ipsae_min selection score. Historical selection scores and the PAE-derived ipSAE values reported here are separate quantities; the historical consensus ranking was not retroactively replaced by the new scoring analysis.
Fold and interface retention
The structural reference is the archived scaffold complex stored with each parent design before carryover optimization, rather than its fresh evaluation prediction. Parent sequences are specified separately from the residue names in the scaffold coordinates. The paired sequences and reference coordinates for the examples in Figures 2 and 3 are supplied in Supplementary Table S3 and the accompanying data. Binder fold retention was assessed by TM-score with fixed residue correspondence, normalized to the starting binder length [18]. Unconstrained TM-align results were retained as a supplementary alignment diagnostic [37]. Interface retention was quantified as the fraction of starting binder–target residue-pair contacts recovered in the new structure, where a contact requires at least one heavy-atom distance within 5 Å. Fold superposition and target-based superposition were treated separately so that preservation of a binder fold did not imply preservation of its placement on the target.
For the TNF trimer, target-chain permutations were restricted to chains with identical sequences. Permutations with target-alignment RMSD within 0.5 Å of the best target alignment were considered, and the mapping minimizing target-aligned binder RMSD was used. Contact overlap was evaluated with that same mapping, rather than selecting a separate permutation to maximize contact retention. Sequence identity was calculated at corresponding binder positions.
For target-side epitope overlap, each residue-pair contact set was projected onto its target-residue indices. Recall is the intersection divided by the reference set; Jaccard overlap is the intersection divided by the union. Binder-side contact-residue recall was calculated analogously. These metrics used the same heavy-atom contact definition and target-chain correspondence as the residue-pair analysis. Supplementary surface views color the reference target by these contact sets and display the saved target-aligned binder coordinates. They identify the contacted surface without assigning an experimentally established functional epitope.
Computational extensions to DNA and small-molecule targets
The DNA tests started from the published DBP006, DBP035, DBP048 and DBP056 protein–dsDNA complexes [27]. For each complex, 12 archived optimization trajectories with rolling carryover and 12 without carryover were evaluated. DNA sequences were fixed and only the protein sequence was updated. Every final sequence was predicted afresh with Boltz-2 without the carried representations. Protein–DNA contacts used the same 5 Å heavy-atom cutoff, with DNA strands matched by sequence. These are repeated optimization trajectories from four starting complexes, not 48 independent starting designs per arm.
The small-molecule test started from EPIC(Q51N) in complex with exatecan (PDB 9NZG) [28]. Twelve archived carry-on and 12 carry-off outputs were predicted afresh with Boltz-2. Pocket-contact recall measured the fraction of reference protein residue positions contacting any ligand heavy atom within 5 Å. Protein C atoms at corresponding sequence positions were superposed to calculate fold RMSD and ligand-centroid displacement. The joint pocket/position criterion was contact recall and centroid displacement Å; the stricter criterion additionally required protein C RMSD Å. All 120 final-sequence records, their structural metrics and artifact identifiers are provided in the supplementary data. These extensions use existing saved outputs and do not include experimental tests of the redesigned sequences.
For the protein–DNA representative, ipSAE was calculated from archived PAE matrices using the published chain-pair formulation [26], a 10 Å PAE cutoff and the reference implementation’s nucleic-acid floor of 2 Å [38]. The maximum over the two directions and the two protein–DNA chain pairs was reported, and the selected values were verified with the reference program. Original and redesigned sequences were evaluated using archived Boltz-2 predictions without MSA or template. The small-molecule comparison uses the saved Boltz-2 ipTM values because the reference ipSAE program excludes ligand atoms. Protein C RMSDs in Figure S5 use fixed residue correspondence to the published source structures, with no outlier rejection. The DNA example has the lowest protein RMSD among carry-on outputs with RMSD Å, contact recall and increased fresh ipSAE. The exatecan example has the lowest sequence identity among carry-on outputs satisfying the same structural thresholds, ligand-centroid displacement Å and increased fresh ipTM. Two of 48 DNA carry-on outputs and two of 12 exatecan carry-on outputs met their respective criteria. These criteria select illustrative examples, rather than estimates of typical improvement. Paired sequences and metrics are supplied with the supplementary data.
Experimental binding data
Binding measurements were performed by Adaptyv Bio. Submitted constructs carried an N- or C-terminal TwinStrep tag; candidate-specific tag positions are supplied in the experimental CSV files. In the provider’s documented BLI format, tagged binders are immobilized on biosensors and exposed to target protein in solution [39]. The exported concentration series span 10–1,000 nM, with 0 nM controls; concentrations and measured replicate counts for each candidate are supplied in experimental_assay_conditions.csv. BLI response series were available for two replicates per measured candidate. TNF classifications and replicate records use the provider export downloaded on 3 October 2026. The analysis uses its exported candidate-level classifications, measured BLI response curves, replicate records and kinetic fits. Ten sequences were submitted in each target–workflow group; the 10 experimentally positive optimized binder sequences are listed in Supplementary Table S2, and all 40 submitted sequences and outcomes are supplied in experimental_binding_results.csv. The unoptimized and optimized groups were selected independently using a common consensus-scoring approach based on Boltz-2, Protenix, AlphaFold2, OpenFold3 and ESMFold2. These groups do not constitute matched experimental parent–child pairs. For TNF, the unoptimized consensus-selection pool comprised the 120 highest-ranked candidates passing Boltz-2 screening. The optimization pool comprised the top 60 starting candidates, with two archived outputs each. All ten submitted unoptimized TNF sequences were also members of the top-60 starting cohort, but the two experimental sets were selected independently. A confirmed hit is a submitted design marked as binding in the provider’s overall result; the provider defines a positive result as clear binding above controls [40]. In these exports, unknown classifications were attributed to insufficient protein expression for binding measurement, rather than a negative binding result. The complete PD-L1 export contains result rows for all 20 submitted sequences; OPT_05, OPT_07 and UNOPT_05 fall in this category and have no measured curves in the supplied package.
For illustrated concentration series, the exported measured response traces are plotted directly, together with the provider’s selected standard-model fits. Representative candidates were chosen from experimentally positive sequences with an exact link to the computational cohort and interpretable concentration-dependent curves; they were not chosen to maximize the reported affinity. Figure 4 shows one replicate of each example; additional replicate and fitting records are retained in the source data. Apparent dissociation constants are quoted as provider-reported values, with kinetic-model dependence and fitted parameter bounds considered in interpretation.
Submitted optimized sequences were matched exactly to archived optimization outputs, and parent identifiers were recovered through recorded lineage. Fresh-prediction metrics in Supplementary Table S1 are included only where the submitted sequence exactly matches a sequence in the primary panel. Historical five-model consensus scores are labeled separately from the newly calculated PAE-derived ipSAE values; missing primary-panel predictions are not replaced by another output from the same parent.
The smallest reported apparent dissociation constant in the optimized TNF set was not used as the central performance endpoint because its fitted dissociation rate reached the lower bound, and kinetic-model choices differed across the dataset. Multivalent interactions can affect the apparent binding behavior of TNF-associated constructs [41]. In the PD-L1 sets, the single unoptimized positive had a lower reported apparent dissociation constant than the optimized positives. These features motivate reporting confirmed-hit yield separately from affinity improvement.
Statistics and figure selection
Mean changes in interface confidence were calculated by pairing each carry-on sequence with its original parent within the same prediction model. The displayed 95% intervals were obtained by bootstrap resampling of 60 parent designs, with 10,000 resamples. For the separate contemporaneous PD-L1 comparison, contact recall was averaged over the two completed trajectories within each parent and arm before calculating paired differences and resampling the 58 complete parents. No multiplication of sample size by the number of prediction models was used. Pooled medians and the share of improved predictions were computed over all 720 paired predictions (six other models, two targets, 60 designs each); pooled means are the simple mean of the 12 model-by-target cohort means. The fold and contact-retention plots display all paired designs and their arithmetic means. Figure 2 and Supplementary Figure S4 illustrate carry-on sequences with binder C RMSD Å, original-contact recall , fresh Boltz-2 ipSAE and a positive ipSAE change relative to the original sequence. Among qualifying designs (eight PD-L1 and four TNF), the example with the lowest target-aligned binder RMSD was selected for each target. Figure 3 examples required original Boltz-2 ipSAE , an original mean ipSAE across the six other models , final ipSAE in each displayed model (Boltz-2, AlphaFold2 and Protenix), and contact recall in fresh Boltz-2 predictions. Among qualifying designs (five PD-L1 and three TNF), the design with the largest six-model mean paired gain was selected. These criteria select illustrative improvement examples. Joint retention and improvement counts required fresh Boltz-2 contact recall and a positive mean paired ipSAE change across the six other models. Molecular graphics use saved coordinates. For TNF, PAE rows and columns were permuted together using the same target-chain mapping as the structural analysis: among sequence-identical subunit permutations with near-optimal target superposition, the correspondence minimizing binder-pose RMSD defines a common subunit correspondence relative to the starting complex. For display, reference chains B, A and C are labeled TNF 1, TNF 2 and TNF 3, respectively. PAE panels share a linear 0–10 Å color scale, saturated at 10 Å; scores are calculated from the original, unclipped PAE arrays.
Computational cost
The TNF design campaign used about 300 GPU hours on Modal, together with CPU and memory resources, for the campaign applications in the 18–21 July 2026 billing window: about 187 hours on A100-80GB, 98 on A10G and 15 on other GPUs (T4 and A100-40GB). Generation and screening accounted for about 179 GPU hours, sequence optimization for 118, final candidate checks for 2.4, and target preparation and transfer for 0.7. GPU hours are the time during which a container held a GPU, including model loading. They were calculated from the resource-level billing report for the delivered campaign applications by dividing the charge for each GPU type by its Modal list price per hour. Experimental work and subsequent manuscript-validation calculations are outside this total.
Use of AI tools
This manuscript was prepared with the assistance of large language models from OpenAI (GPT) and Anthropic (Claude), used through the Codex and Claude Code applications. These tools were used for drafting and editing the text, for writing analysis and figure-generation code, and for formatting. The author reviewed all content, including the data, analyses, figures, citations and text, and takes full responsibility for it. AI tools are not listed as authors.
Acknowledgements
We thank Shintaro Minami for valuable discussions on protein binder design and helpful comments on the manuscript.
Competing interests
Ken Osumi is the founder of FoldArc and an inventor on a pending patent application relating to structural carryover for protein sequence optimization.
Data availability
The supplementary data provide all 40 experimentally submitted sequences and outcomes, paired parent and optimized sequences for the structural and PAE examples in Figures 2 and 3, and the corresponding starting reference complexes. The representative pairs support independent sequence-based structure prediction and comparison with the starting arrangements. The reference PDBs retain the archived scaffold residue names, which can differ from the parent sequence or be placeholders; the sequence CSV is authoritative for the parent and optimized sequences. Reference chain assignments and target sequences are provided in representative_reference_structures.csv. Paired sequences for the nonprotein examples and all 120 extension outputs are also supplied.
Code availability
Code for ArcRefine refinement and independent Boltz-2 prediction is available at https://github.com/ken-osumi/ArcRefine.
References
Cao L., Coventry B., Goreshnik I. et al. Design of protein-binding proteins from the target structure alone. Nature 605, 551–560 (2022). https://doi.org/10.1038/s41586-022-04654-9
Bennett N.R., Coventry B., Goreshnik I. et al. Improving de novo protein binder design with deep learning. Nature Communications 14, 2625 (2023). https://doi.org/10.1038/s41467-023-38328-5
Watson J.L., Juergens D., Bennett N.R. et al. De novo design of protein structure and function with RFdiffusion. Nature 620, 1089–1100 (2023). https://doi.org/10.1038/s41586-023-06415-8
Butcher J., Krishna R., Mitra R. et al. De novo Design of All-atom Biomolecular Interactions with RFdiffusion3. bioRxiv (2025). https://doi.org/10.1101/2025.09.18.676967
Ren M., Sun J., Guan J. et al. PXDesign: Fast, Modular, and Accurate De Novo Design of Protein Binders. bioRxiv (2025). https://doi.org/10.1101/2025.08.15.670450
Stark H., Faltings F., Choi M. et al. BoltzGen: Toward Universal Binder Design. bioRxiv (2025). https://doi.org/10.1101/2025.11.20.689494
Didi K., Zhang Z., Zhou G. et al. Scaling Atomistic Protein Binder Design with Generative Pretraining and Test-Time Compute. arXiv (2026). https://arxiv.org/abs/2603.27950
BoltzGen contributors. BoltzGen: universal binder design, software repository and usage guide (2026). https://github.com/HannesStark/boltzgen Accessed 1 October 2026.
Zambaldi V., La D., Chu A.E. et al. De novo design of high-affinity protein binders with AlphaProteo. arXiv (2024). https://arxiv.org/abs/2409.08022
Weng J., Wu Z., Xing B. et al. Design of minibinder proteins as universal antagonists against canine and human TNF. Communications Biology 8, 1639 (2025). https://doi.org/10.1038/s42003-025-09030-7
Anthropic. How Claude is accelerating protein design and analytical chemistry. Research blog post (18 August 2026). https://www.anthropic.com/research/Claude-accelerates-protein-design
Pacesa M., Nickel L., Schellhaas C. et al. One-shot design of functional protein binders with BindCraft. Nature 646, 483–492 (2025). https://doi.org/10.1038/s41586-025-09429-6
Boyd N., Guns S., Escalante Bio. Mosaic. Software repository (2025). https://github.com/escalante-bio/mosaic Accessed 1 October 2026.
Boyd N., Guns S. Minibinder design is just not that hard. Escalante Blog (29 August 2025). https://blog.escalante.bio/minibinder-design-is-just-not-that-hard/ Accessed 1 October 2026.
BindCraft contributors. De novo binder design with BindCraft. Software wiki (2026). https://github.com/martinpacesa/BindCraft/wiki/De-novo-binder-design-with-BindCraft Accessed 1 October 2026.
Zak K.M., Kitel R., Przetocka S. et al. Structure of the Complex of Human Programmed Death 1, PD-1, and Its Ligand PD-L1. Structure 23, 2341–2348 (2015). https://doi.org/10.1016/j.str.2015.09.010
Monaco C., Nanchahal J., Taylor P., Feldmann M. Anti-TNF therapy: past, present and future. International Immunology 27, 55–62 (2015). https://doi.org/10.1093/intimm/dxu102
Zhang Y., Skolnick J. Scoring function for automated assessment of protein structure template quality. Proteins: Structure, Function, and Bioinformatics 57, 702–710 (2004). https://doi.org/10.1002/prot.20264
Jumper J., Evans R., Pritzel A. et al. Highly accurate protein structure prediction with AlphaFold. Nature 596, 583–589 (2021). https://doi.org/10.1038/s41586-021-03819-2
Evans R., O’Neill M., Pritzel A. et al. Protein complex prediction with AlphaFold-Multimer. bioRxiv (2021). https://doi.org/10.1101/2021.10.04.463034
Zhang Y., Gong C., Sun J. et al. Protenix-v2: Broadening the Reach of Structure Prediction and Biomolecular Design. bioRxiv (2026). https://doi.org/10.64898/2026.04.10.717613
The OpenFold3 Team. OpenFold3: open-source biomolecular structure prediction. Software repository (2026). https://github.com/aqlaboratory/openfold-3 Accessed 1 October 2026.
Corley N., Mathis S., Krishna R. et al. Accelerating Biomolecular Modeling with AtomWorks and RF3. bioRxiv (2025). https://doi.org/10.1101/2025.08.14.670328
Candido S., Hayes T., Derry A. et al. Language Modeling Materializes a World Model of Protein Biology. bioRxiv (2026). https://doi.org/10.64898/2026.06.03.729735
Aureka AI OpenDDE project. Folding, Reasoning, and Scaling with Open-source Drug Discovery Engine. arXiv (2026). https://arxiv.org/abs/2607.03787
Dunbrack R.L. Jr. Rēs ipSAE loquuntur: What’s wrong with AlphaFold’s ipTM score and how to fix it. bioRxiv (2025). https://doi.org/10.1101/2025.02.10.637595
Glasscock C.J., Pecoraro R.J., McHugh R. et al. Computational design of sequence-specific DNA-binding proteins. Nature Structural & Molecular Biology 32, 2252–2261 (2025). https://doi.org/10.1038/s41594-025-01669-4
Fry B., Slaw K., Polizzi N.F. Zero-shot design of drug-binding proteins via neural iterative selection–expansion. Nature 656, 237–249 (2026). https://doi.org/10.1038/s41586-026-10670-w
Didi K., Reidenbach D., Penner M. et al. Latent generative search unlocks de novo design of untapped biomolecular interactions at scale. bioRxiv (2026). https://doi.org/10.64898/2026.09.12.751118
Dauparas J., Anishchenko I., Bennett N. et al. Robust deep learning–based protein sequence design using ProteinMPNN. Science 378, 49–56 (2022). https://doi.org/10.1126/science.add2187
Fang M., Wang C., Shi J. et al. HalluDesign: Protein Optimization and de novo Design via Iterative Structure Hallucination and Sequence Design. bioRxiv (2026). https://doi.org/10.1101/2025.11.08.686881
Lee M., Kalicki C., Jeon M. et al. ConforNets: Latents-Based Conformational Control in OpenFold3. arXiv (2026). https://arxiv.org/abs/2604.18559
Boyd N., Guns S. Teaching generative models to hallucinate. Escalante Blog (11 March 2026). https://blog.escalante.bio/teaching-generative-models-to-hallucinate/ Accessed 2 October 2026.
Passaro S., Corso G., Wohlwend J. et al. Boltz-2: Towards Accurate and Efficient Binding Affinity Prediction. bioRxiv (2025). https://doi.org/10.1101/2025.06.14.659707
Goverde C.A., Pacesa M., Goldbach N. et al. Computational design of soluble and functional membrane protein analogues. Nature 631, 449–458 (2024). https://doi.org/10.1038/s41586-024-07601-y
Abramson J., Adler J., Dunger J. et al. Accurate structure prediction of biomolecular interactions with AlphaFold 3. Nature 630, 493–500 (2024). https://doi.org/10.1038/s41586-024-07487-w
Zhang Y., Skolnick J. TM-align: a protein structure alignment algorithm based on the TM-score. Nucleic Acids Research 33, 2302–2309 (2005). https://doi.org/10.1093/nar/gki524
Dunbrack R.L. Jr. IPSAE: reference scoring implementation,
ipsae.py, version 4. Software repository (2026). https://github.com/DunbrackLab/IPSAE Accessed 2 October 2026.Adaptyv Bio. Biolayer Interferometry (BLI). Service documentation. https://docs.adaptyvbio.com/wiki/technologies/BLI Accessed 2 October 2026.
Adaptyv Bio. Binding. Service documentation. https://docs.adaptyvbio.com/docs/experiment-types/binding Accessed 2 October 2026.
Beirnaert E., Desmyter A., Spinelli S. et al. Bivalent Llama Single-Domain Antibody Fragments against Tumor Necrosis Factor Have Picomolar Potencies due to Intramolecular Interactions. Frontiers in Immunology 8, 867 (2017). https://doi.org/10.3389/fimmu.2017.00867
Supplementary information
Mean sequence identity to the starting design across 60 parent designs per target was 36.1% with carryover and 12.3% without carryover for PD-L1, and 33.0% and 12.7%, respectively, for TNF.
Supplementary Table S1. Lineage of submitted optimized sequences
All 20 submissions match archived carry-on outputs exactly. Low expression denotes insufficient protein expression for binding measurement. Parent IDs identify the starting design. Identity is the fraction of matching binder residues. Historical consensus is the five-model score used in selection, not the PAE-derived ipSAE reported for fresh predictions. Fresh contact recall is from Boltz-2, and fresh ipSAE is the mean over the six other predictors. A dash means the exact submitted sequence was not in the primary fresh-prediction panel. Complete sequences, artifact IDs and model-specific values are supplied in supplementary_bli_lineage.csv.
PD-L1
| Submission | Parent ID | Identity | Historical consensus | Fresh contacts | Fresh ipSAE | BLI |
|---|---|---|---|---|---|---|
| PDL1_OPT_01 | 343852570dfc1734 |
0.362 | 0.902 | 0.457 | 0.919 | No binding |
| PDL1_OPT_02 | 343852570dfc1734 |
0.362 | 0.895 | – | – | No binding |
| PDL1_OPT_03 | f6702dbfa428cb9d |
0.496 | 0.895 | 0.646 | 0.896 | Binding |
| PDL1_OPT_04 | e0bd49381073cea0 |
0.455 | 0.893 | 0.569 | 0.891 | Binding |
| PDL1_OPT_05 | d903b729727ed3a9 |
0.415 | 0.890 | – | – | Low expression |
| PDL1_OPT_06 | 219300eb52b39ef4 |
0.298 | 0.890 | – | – | No binding |
| PDL1_OPT_07 | ef3379bf0632ac51 |
0.521 | 0.889 | 0.792 | 0.908 | Low expression |
| PDL1_OPT_08 | bfd73f0577f89883 |
0.434 | 0.889 | 0.784 | 0.880 | Binding |
| PDL1_OPT_09 | 252782ebb42d331d |
0.382 | 0.889 | 0.531 | 0.895 | Binding |
| PDL1_OPT_10 | 0594b94289fa9fbe |
0.350 | 0.888 | 0.050 | 0.902 | No binding |
TNF
| Submission | Parent ID | Identity | Historical consensus | Fresh contacts | Fresh ipSAE | BLI |
|---|---|---|---|---|---|---|
| TNFA_OPT_01 | 6f5c9144447de15a |
0.322 | 0.858 | 0.667 | 0.653 | Binding |
| TNFA_OPT_02 | a8820f73067e141d |
0.433 | 0.830 | – | – | Binding |
| TNFA_OPT_03 | b6248be78faa265f |
0.308 | 0.828 | 0.595 | 0.601 | No binding |
| TNFA_OPT_04 | f64e62f9ce0e716d |
0.405 | 0.822 | 0.690 | 0.618 | Binding |
| TNFA_OPT_05 | a0db6e65c442e4f9 |
0.387 | 0.821 | – | – | Binding |
| TNFA_OPT_06 | ee57d0e01ced1135 |
0.370 | 0.817 | 0.717 | 0.638 | Binding |
| TNFA_OPT_07 | 3673150eb5e543c1 |
0.269 | 0.814 | 0.703 | 0.657 | Binding |
| TNFA_OPT_08 | 6f5c9144447de15a |
0.295 | 0.814 | – | – | No binding |
| TNFA_OPT_09 | 1753899f86367573 |
0.352 | 0.801 | – | – | No binding |
| TNFA_OPT_10 | 8013f10b822045ee |
0.301 | 0.795 | – | – | No binding |
Supplementary Table S2.
Experimentally positive optimized sequences
The 10 optimized designs classified as binding are listed: four PD-L1 and six TNF binders. These are binder-core sequences, excluding experimental tags and linkers. All 40 submitted sequences, including unoptimized designs and non-positive outcomes, and candidate-specific tag positions are supplied in experimental_binding_results.csv. Line breaks are for display only.
PD-L1
| Candidate ID | Amino acid sequence |
|---|---|
| PDL1_OPT_03 | SLEELVREAKELAEEAAEAAEAGDVERAAELAEEAAELTAEAIRLAGAEEAAERFREAAERAVEAIRAGDVEAAREAVAEVVEVVHEIAAAGAYGAAKAAILVAAALARAARAAAAR |
| PDL1_OPT_04 | SAEELAERAEELIEEAEELIEEGTPEAYREALRLLFKAVVLAAELLELGAYEEAAELLERAAELLERLAERAPELRRHALEVLALAYRVLAEAYEALGDEERAAEARARAAEAAAAAAAAP |
| PDL1_OPT_08 | SAEEVTEAAREVLEAARRLVEAARAGDEEAVREELREVAEANERLNELVGNPKVARQHIEQAREAVEAGDLVTAASHAFAAAVVLRDAVERRLSPEDAREPVELLEEAARLLGEAVELLSRY |
| PDL1_OPT_09 | MSPEELAEEIKEVVEENLSEKMAEKAVAAADALLAAVRASGLSEEAQAAVLEAALEATKRLVEAAKAGDEEKMRKIVNETVTRIRAAARAAGASAAAITAIVAEALKIALAIISDAELKELGK |
TNF
| Candidate ID | Amino acid sequence |
|---|---|
| TNFA_OPT_01 | YLLEEAKEAIREVVALVRAGAPVEEVVEAAREALELIAKLSLEDAIEAAYYLVTGALNAAVETGRVETFRALAELFAEAAAAEEDPDVAGNIAVALADPAVLAARLGRWEMADAGVEALRALAAARPEFRALARQVEARVADYKAS |
| TNFA_OPT_02 | SKEEAREIAIEALRLAVWTARFHAEELRANADADEEYRRFVIERAARALRYAAYELHWAAELAREAGDERTARLAEEAARVAEEAARRVEELAEKNDVEGAAEVAEEAARRLEELLEELE |
| TNFA_OPT_04 | QEEEERLRVAREYAVRLLEAAVRALEAALELARKAGASEEAIEAVEEALEAVREALERVRRAESLEELRAVVAEAMRAVGEAAETLFKLVESYGEFVVYRAVRAVVDALYEAVAALDAGLSVEELREWFEYAVALVEYALREVEAALA |
| TNFA_OPT_05 | SHLRELVLENAENVVRLAEAIAELASPEVAELVLELAELVREAAETAVADESASEEALDTLLLALRAVVSQLYEMLWLLENRDEFPPEELYADLAAEAERAARALAEAAEALAAELPETAALLAEAAEAARELAEAIRAEGA |
| TNFA_OPT_06 | YAADTAIALEAVERVEEIALEAIARAKERILSEEEAEEFVERLREVLLETIEALKNLSEEEKAFMLERAERVANNSLYELRWAIEQGSRELNVQAVATAGIRALDVVEEAAMFATDTAGYAAVAAAARAAKAELAAAA |
| TNFA_OPT_07 | SEVEELAERLEELARELREAAEAGDVERARELAREAAEAAREAARAAREAGVSEELVLLLEEYADLLEYNARTIETAEDAERAARVAEEAAEVARAAARDAEKL |
Supplementary Table S3.
Paired sequences for representative designs
Parent and carry-on sequences correspond to the structural examples in Figure 2 (also Figure S4) and the PAE examples in Figure 3. Sequences and figure mappings are supplied in representative_sequence_pairs.csv, with the four reference complexes in reference_structures/. The sequence pairs are the inputs for independent re-prediction; the reference complexes define the starting geometry. The optimized F3B sequence is the experimentally positive TNFA_OPT_07 in Table S2; the other three optimized examples were not experimentally tested.
F2A — PD-L1 (Figure 2A)
Parent ID: 530bcf1c39711082. The optimized sequence was not experimentally tested.
| Sequence | Amino acid sequence |
|---|---|
| Parent | KYSIEIVATTKLSREEQNELAAEIARAAARAGAEDVKIDVDSEKGTIKVKASGFASKEAAEKAAKEIEKILKDHGATVKSSKVE |
| Optimized | MYTVTVVAAVPADRLAQNELAAALAKAAAKAGAESVKVTIDAAARTVTAVATGVPSEEAAEALAAAMRAAVEAHGGTVLSVEVE |
F2B — TNF (Figure 2B)
Parent ID: 83be67b8eba31a32. The optimized sequence was not experimentally tested.
| Sequence | Amino acid sequence |
|---|---|
| Parent | EELLRLLDEAENLFNAATSIVARAAREARDWELYEQTRRLRGEGDKIYEEAYEAIENKDWEKALKALEEFRKLLEELLELAKASPALTPEQKAEIAELAEKAKEVIEKAKKLLKEA |
| Optimized | SEVVELNKKAENAADAAASVVYRAALAANDEAGQAAAAAAYRAVAAAAVAAYDAAEAGDWEAAVEALEELREAIEEVREVARATPSLSEEQLAEVEELTEKALELAEEAIELAREA |
F3A — PD-L1 (Figure 3A)
Parent ID: 940176aff4ce5fed. The optimized sequence was not experimentally tested.
| Sequence | Amino acid sequence |
|---|---|
| Parent | SEAREAIIEAAVALANAINTAGDEEAKALTAEALEALRASFAKLAEGDKAGAEEEAKKAYELLEKAVELLKGSEETKELVKKAVKLLYEAVKAYLAGDKEKAKKLAEEAKKLAEEAEKKAKEEK |
| Optimized | MEVRDLLTEAAVLIANALYASGDPEVAELADEALVAFHEALRAIAEGDKEKALEAAERFLELALEAAELAPVSEEARELLKEAARLLAEALKAAAEGDEEKAKELAEEAIELAEEALELIEAER |
F3B — TNF (Figure 3B)
Parent ID: 3673150eb5e543c1. The optimized sequence is TNFA_OPT_07 in Table S2.
| Sequence | Amino acid sequence |
|---|---|
| Parent | GKLKELLKKLKELLKKIEEALAAKKYEEAKKYAKEALEILKEALKLFKEENLPEEALEAFEEKIEQLEYLLKQPANLATAIDLLRLLKSVLEQLEDIVKLLEAR |
| Optimized | See TNFA_OPT_07 in Table S2; the complete sequence is also included in the paired CSV. |